
Retirement Calculator Guide: How to Estimate Your Retirement Corpus in India

Say you spend ₹2 lakh a month today and want to know how much you will need to retire.
You enter your details into a retirement calculator. The answer comes back at roughly ₹40 crore.
Then you change just one assumption: inflation. Instead of 9%, you enter 11%.
Your retirement target is now about ₹58 crore.
Nothing about your life changed. Your current expenses did not change. Neither did your retirement age or the lifestyle you want after you stop working. One assumption moved by two percentage points, and the answer moved by ₹18 crore.
That is the most important thing to understand about any retirement calculator. The number it gives you can look remarkably precise, even though it is built on assumptions about the next 20, 30 or 40 years.
So the real value of a retirement calculator is not in giving you the number you need. It is in showing you how that number changes when your assumptions do.
In short: A retirement calculator projects your current expenses to retirement using an assumed inflation rate, then estimates the corpus required to fund those expenses over your retirement years. The three inputs worth paying particularly close attention to are inflation, how long the corpus needs to last, and whether your return assumptions account for tax. Instead of treating the first output as the answer, use the calculator to test multiple scenarios.
On this page
- What does a retirement calculator actually do?
- Which inputs matter most (and which people get wrong)
- In their words
- Why one flat inflation rate breaks the estimate
- Stress-testing with Monte Carlo and scenario ranges
- Reading the output: corpus, monthly need and shortfall
- Common assumptions that can distort calculator outputs
- A walkthrough of the Dezerv Retirement Calculator
What does a retirement calculator actually do?
At its core, a retirement calculator does three things.
It takes what you spend today and projects that expense to the year you retire. It estimates how large a corpus would be required to keep funding those expenses through retirement. And it works backwards to tell you how much you may need to invest between now and then.
The maths can become sophisticated, but the basic structure does not change.
That is also why a calculator should not be mistaken for a prediction. If you tell it inflation will be 6%, returns will be 12% and your retirement will last 25 years, it will calculate accordingly. It has no way of knowing whether those assumptions will resemble your actual life.
The underlying corpus calculation, and why retirement numbers can look unusually large when expressed in future rupees, is explained in How much money do you need to retire in India?.
Which inputs matter most (and which people get wrong)
Every field on a retirement calculator looks equally important. In practice, some assumptions can move the final number far more than others.
- Inflation rate: One of the biggest levers because even a small difference compounds for decades, first while you are approaching retirement and then as your expenses continue rising after it.
- Retirement horizon: Retiring at 60 and planning until 85 is a very different funding problem from planning until 95.
- Current annual spending: This is the base from which everything else is calculated. Understate it by leaving out travel, healthcare, domestic help, home maintenance or irregular expenses, and every subsequent calculation starts too low.
- Return assumption: This matters too, particularly when a calculator lets you enter an optimistic rate without accounting for taxes or changes in asset allocation later in life.
- Desired legacy: If you want to leave money behind, that amount cannot also be used to fund your retirement spending.
The difference becomes clearer when you hold the household constant and change just one assumption.
Consider a 40-year-old metro household spending ₹2 lakh a month today, retiring at 60 and planning until age 90. Assume its expenses rise at a blended household inflation rate of around 9%, based on the category-level assumptions explained below, rather than headline Consumer Price Index (CPI). On the assumptions used in this sample calculation, the required corpus at retirement comes to roughly ₹40 crore.
₹40 crore can sound intimidating because it is a number expressed 20 years into the future. For scale, if the ₹40 crore future requirement is mathematically discounted over 20 years using an illustrative 12% annual rate, the resulting figure is roughly ₹4.2 crore today
That does not mean ₹4.2 crore today is expected or guaranteed to become ₹40 crore. It is simply another way of expressing the sample future requirement using the stated return assumption. Change that assumption and the present-value number changes too.
Both figures are illustrations based on the assumptions above, not forecasts, return guarantees or personalised advice.
How much each input moves the required corpus
Changing one input at a time from the roughly ₹40 crore base case, while holding all other assumptions constant. Sample scenario; near-zero real return; not a forecast.
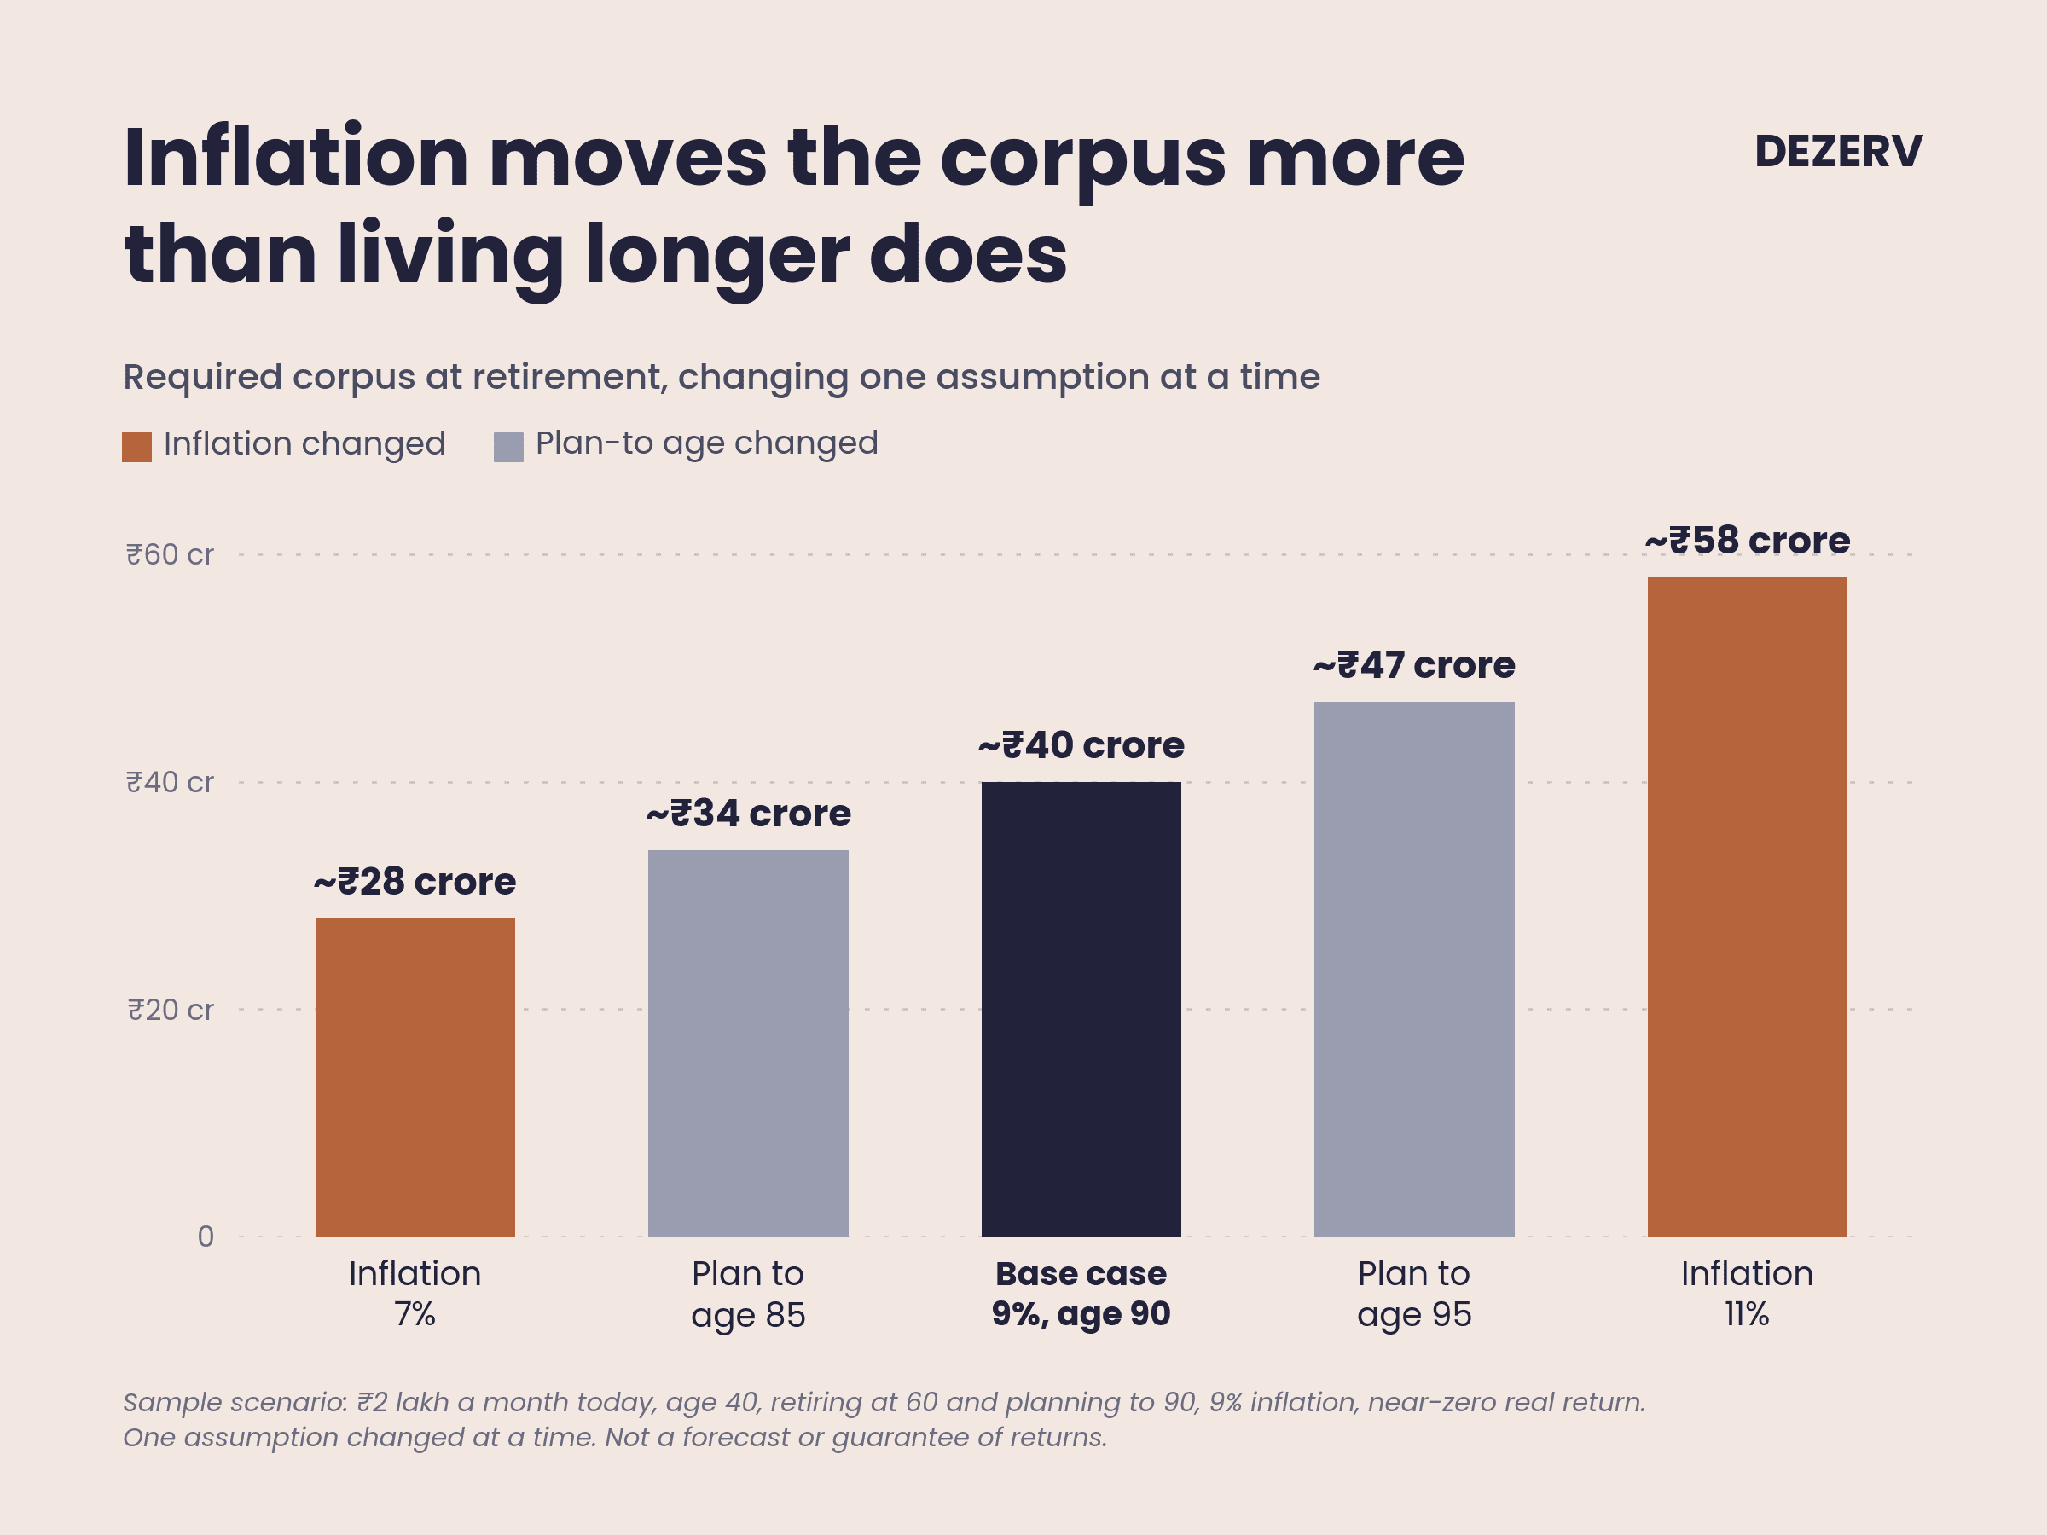
Two percentage points on inflation change this sample corpus by ₹12–18 crore. Changing the retirement horizon by five years moves it by about ₹7 crore.
The point is not that 9% is the “correct” inflation rate or that everyone should plan until 90. It is that the output can be extremely sensitive to assumptions that are easy to treat as routine form fields.
In their words
“The investor's chief problem — and even his worst enemy — is likely to be himself.”
— Benjamin Graham, The Intelligent Investor
A retirement calculator gives you plenty of ways to make the answer more comfortable. Increase expected returns a little. Reduce inflation. Assume you will need the money for fewer years.
The calculation still works. It just answers the question you asked it.
That is why using a calculator well requires resisting the temptation to keep changing the inputs until you reach a corpus you like.
Why one flat inflation rate breaks the estimate
Most retirement calculators ask for one inflation number.
Your expenses, however, do not rise at one uniform rate.
Headline CPI tracks a nationally averaged basket of goods and services. A higher-spending household can have a very different spending mix, with a larger share going towards categories such as private healthcare, domestic staff, education and travel, where costs can rise at different rates.
For that reason, this analysis uses an illustrative household inflation assumption of roughly 8–9%, rather than treating headline CPI as a household’s personal inflation rate.
That estimate is built from category-level assumptions such as:
- Healthcare inflation: around 12–14%
- Education inflation: around 10–12%
Combined across an illustrative higher-spending household basket with travel and other expenses, those assumptions produce a blended inflation estimate of roughly 8–9%.
These category ranges and the resulting 8–9% blended assumption are used by Dezerv for this illustrative spending basket. They are not official inflation statistics or a rate that applies to every household.
This is why automatically using headline CPI as your household inflation assumption can materially change a long-term retirement estimate.
If your calculator accepts only one inflation assumption, the more useful exercise is to estimate the blended inflation of your own spending basket rather than automatically using headline CPI.
You can read the full reasoning in How inflation affects retirement planning in India.
Stress-testing with Monte Carlo and scenario ranges
There is another assumption hidden inside many simple retirement calculations: that returns arrive neatly.
They do not.
Two retirees can earn the same average return over a long period and still have very different experiences if one suffers a severe market decline early in retirement while making withdrawals.
That is sequence-of-returns risk. William Bengen's 1994 work on retirement withdrawals helped quantify why the order in which returns arrive can matter when withdrawals are being made.
There are two useful ways to account for this:
- Scenario ranges: Rerun the calculator with a pessimistic, base and optimistic set of inputs. The spread between the three can tell you more than the middle number alone.
- Monte Carlo: More advanced tools run thousands of randomised return paths and show the proportion of simulated outcomes in which the modelled corpus lasts through the stated retirement period.
Historical market data helps explain why looking beyond an average matters.
Rolling returns of the Nifty 50 TRI by holding period
Historical data; past performance does not indicate future returns.
Analysis of Nifty 50 TRI rolling returns since the index's mid-1999 inception; figures as on 30 June 2026. Returns for periods longer than one year are annualised. Past performance does not indicate future returns. Underlying sources: NSE / Nifty Indices, Ace MF index data.
In this historical dataset, one-year outcomes varied enormously, while the range of annualised returns narrowed across longer holding periods.
Historical rolling returns cannot tell us what the next retirement period will look like. What they do show is why building a retirement calculation around one assumed annual return can hide an important part of the risk.
A useful retirement plan therefore needs to be tested beyond the base case.
Reading the output: corpus, monthly need and shortfall
Once the calculator finishes, three numbers deserve your attention.
The corpus is the total amount the model estimates you will need at retirement. Since it is usually displayed in future rupees, translating it back into today's terms can help you understand its scale, as long as you are clear about the return or discount assumption being used.
The monthly need tells you what your current lifestyle could cost by retirement after applying the inflation assumptions. This is worth checking closely. If the number does not resemble the life you are actually planning for, there is little point analysing the corpus that follows from it.
Then there is the shortfall or gap: the difference between the corpus you are currently on track to build and the amount estimated by the model.
A large gap is not a definitive conclusion. It is a signal to revisit the assumptions or inputs behind the plan. Depending on your circumstances, that could mean increasing savings, changing the retirement date, reconsidering future spending or reassessing some of the assumptions in the model.
Common assumptions that can distort calculator outputs
A calculator can give you a lower corpus without anything being mathematically wrong. Sometimes, the assumptions themselves are doing the work.
Watch for:
- Consistently high, flat returns through retirement: This can ignore the fact that portfolio allocation may change with age.
- No tax assumption: Using pre-tax return assumptions without considering applicable taxes can overstate the amount potentially available for spending
- One inflation rate: Particularly when headline CPI is used without considering how your own spending basket behaves.
- No separate healthcare assumption: Healthcare costs can rise differently from general household expenses and may warrant separate consideration in a retirement calculation. You can read more about this in The healthcare corpus: budgeting for medical inflation.
- A shorter retirement horizon: Planning only until 80 or 85 can materially reduce the estimated corpus because the model assumes fewer years of retirement need to be funded.
Each of these can produce a lower estimated corpus than a calculation using more conservative assumptions.
These are also part of the broader retirement-planning errors covered in The biggest retirement planning mistakes Indian investors make.
A walkthrough of the Dezerv Retirement Calculator
The Dezerv Retirement Calculator lets you enter your current age, retirement age, life expectancy, current expenses, desired legacy, inflation assumptions and expected returns.
It then uses those inputs to estimate the retirement corpus under the assumptions entered. The calculator also lets you account for tax on investment returns and shows the maths behind the result rather than treating the final corpus as a black box.
A more useful way to use it is to go beyond running your numbers once
Start with the assumptions you consider reasonable. Then change them.
What happens if inflation is higher? What if you live five years longer than expected? What if your post-tax return is lower?
Seeing how much the answer moves gives you information that the original corpus number cannot.
Model your own numbers in the Dezerv Retirement Calculator.
Key takeaways
- A retirement calculator estimates a corpus based on the assumptions you enter. Treat the output as a scenario to test, rather than a prediction.
- Inflation, the retirement horizon and post-tax returns can materially change the corpus you arrive at.
- Consider an inflation assumption that reflects your actual spending basket rather than automatically relying on headline CPI.
- Stress-test the plan by changing key assumptions and comparing more demanding scenarios with your base case.
- Translate large future-value corpus numbers into today's terms when you need context, while being clear about the return or discount assumption being used.
- You can run different scenarios in the Dezerv Retirement Calculator to see how the estimated corpus changes when the assumptions do
Try the Dezerv Retirement Calculator.
Frequently Asked Questions
What does a retirement calculator actually do?
A retirement calculator projects your current expenses to your retirement date using an assumed inflation rate, estimates the corpus required to fund those expenses over your retirement years, and works backwards to estimate how much you may need to invest to get there.
The output is a projection built on the assumptions entered, not a guaranteed future figure.
What inflation rate should I put into a retirement calculator?
There is no single inflation rate that applies equally to every household.
Your spending may include healthcare, domestic staff, education, travel and other categories whose costs can move differently from overall CPI. A useful approach is to estimate the blended inflation rate of your own spending rather than automatically using headline CPI.
In the illustrative higher-spending household used in this article, Dezerv's blended estimate is around 8–9%, based on the category-level assumptions described above. This is an analytical assumption for the sample spending basket, not an official inflation rate or a rate that applies to every household.
Why do retirement calculators give such different answers?
Because small changes compound over long periods.
Moving inflation or returns by even one or two percentage points, or changing the number of retirement years being funded, can materially alter the required corpus.
In the sample scenario used above, changing only the inflation assumption from 9% to 11%, while holding the other assumptions constant, moved the estimated corpus from roughly ₹40 crore to ₹58 crore.
That sensitivity is why comparing several scenarios is more informative than relying on one calculation.
What is sequence-of-returns risk?
Sequence-of-returns risk refers to the impact that the order of investment returns can have when withdrawals are being made from a portfolio, particularly if poor returns occur early in retirement.
Even if the long-term average return eventually looks reasonable, withdrawing money after early losses can leave less capital available to participate in a subsequent recovery.
Scenario testing and Monte Carlo analysis are two ways of examining this risk rather than assuming returns arrive evenly.
Disclaimer: Dezerv Investments Private Limited is a SEBI-registered Portfolio Manager (Registration No. INP000007377). Distribution services are offered by Dezerv Distribution Services Private Limited, a wholly owned subsidiary of Dezerv Investments Private Limited, under AMFI Registration No. ARN-248439 and APMI Registration No. APRN-00615. This article is intended solely for general educational and informational purposes and should not be construed as personalised investment, financial planning, tax or legal advice, or as a recommendation, offer or solicitation to invest in any security, financial product or investment strategy. Readers are advised to consult their financial advisor before making investment decisions based on the information provided herein.
The retirement corpus figures, assumptions, calculations, historical performance data and calculator outputs in this article are illustrative and based on the assumptions and methodologies stated herein. They are not forecasts or guarantees of future returns or retirement outcomes, and actual outcomes may vary based on individual circumstances and prevailing conditions. Actual outcomes may vary depending on individual circumstances and prevailing market, economic, tax and regulatory conditions. The information contained herein is not a complete disclosure of every material fact, term or condition.
Investment in the securities market is subject to market risks. Please read all related documents carefully before investing. Past performance, where referred to, is not indicative of future performance and may or may not be sustained.


