
How Inflation Affects Retirement Planning in India: Understanding Lifestyle Inflation and Your Retirement Corpus

Imagine retiring with the number you had spent twenty years working towards.
The house is paid for. The children are independent. Your retirement corpus looks substantial on paper.
And yet, the life you planned for keeps getting more expensive.
The hospital bill rises faster than expected. So does the cost of domestic help. Holidays cost more. Eating out costs more. The conveniences you have come to take for granted keep moving further away from the prices you remember.
This is the part retirement planning can underestimate.
Most calculations ask you to assume an inflation rate. But the inflation rate reported in the news is not necessarily the inflation rate of your life.
A household that spends more on private healthcare, domestic help, education, travel and leisure may experience price increases differently from the broader Consumer Price Index (CPI), because these categories do not necessarily move at the same rate as the overall CPI basket.
That difference can become significant over time.
In the sample scenario used in this article, a household spending ₹2 lakh a month today would need about ₹7.7 lakh a month in twenty years at 7% inflation, ₹11.2 lakh at 9%, and ₹13.5 lakh at 10%.
Same lifestyle. Same retirement. Very different number.
So before asking how much you need to retire, there is another question worth answering first:
What does your own lifestyle actually inflate at?
In short: Inflation affects retirement twice: it increases how much your lifestyle may cost by the time you retire and continues to reduce purchasing power after retirement. Headline CPI may not fully reflect an individual household’s spending experience because categories such as healthcare, domestic help, education and travel can move at different rates. In this article, we test 7%, 9% and 10% lifestyle-inflation scenarios to show how much the assumption alone can change the retirement corpus. |
On this page
- How does inflation affect retirement planning?
- Why lifestyle inflation can run above headline CPI
- What 7% vs 9% vs 10% does to a corpus
- Which categories inflate fastest
- How to inflation-proof a retirement portfolio
- In their words
- Healthcare inflation is a separate force
- Key takeaways
How does inflation affect retirement planning?
Inflation affects retirement in two different stages.
First, it raises the cost of the lifestyle you want to fund by the time you retire.
Then, once you stop earning, it continues to reduce what the same amount of money can buy.
Take ₹1 crore.
At 9% annual inflation, ₹1 crore thirty years from now would have purchasing power equivalent to roughly ₹7.5 lakh today. At 7%, the equivalent is about ₹13.1 lakh. At 10%, about ₹5.7 lakh.
These are sample scenarios at the stated inflation rates. The ₹1 crore figure itself does not change. Its purchasing power does.
This is also why retirement corpus numbers quoted twenty or thirty years into the future can look unusually large. They already include years of rising costs.
The full method is covered in how much you need to retire in India.
Why lifestyle inflation can run above headline CPI
The Consumer Price Index measures price changes across a nationally representative basket of goods and services.
Your household has its own basket.
A household that spends on domestic help, private healthcare, education, a car, regular travel and leisure does not necessarily experience inflation in the same way as headline CPI, which was about 4–6% around the period considered here (MoSPI).
ICICI Lombard estimates medical costs will rise at around 12–14% a year. Education and travel can also see price increases. Domestic help and other services can also rise faster than general CPI.
The exact inflation experienced by any household will depend on how it spends.
Based on these underlying expense categories, Dezerv estimates that blended lifestyle inflation for the kind of spending basket described above can be roughly 8–9% over time.
Note: Dezerv’s inflation estimate is based on category-level assumptions for healthcare, domestic staff, education and travel, blended to roughly 8–9% for the illustrative affluent-household basket. This is not an official inflation statistic.
For the calculations in this article, we use 9% as the central scenario, alongside 7% and 10% sensitivity cases.
This is a Dezerv estimate based on multiple expense-category data points, not an official inflation statistic or a rate that will apply to every household.
What 7% vs 9% vs 10% does to a corpus
This is where a seemingly small change in the assumption becomes much easier to see.
Take a household spending ₹2 lakh a month today.
Assume retirement is 20 years away and that the corpus then needs to fund 30 years of spending.
Now change only the inflation assumption.
Corpus needed at retirement for a ₹2 lakh-a-month household retiring in 20 years
| Lifestyle inflation | Monthly spend at retirement | Corpus needed |
| 7% | ~₹7.7 lakh | ~₹28 crore |
| 9% | ~₹11.2 lakh | ~₹40 crore |
| 10% | ~₹13.5 lakh | ~₹48 crore |
This is a sample illustration based on the stated assumptions: ₹2 lakh a month today, retirement in 20 years, 30-year drawdown. This is not a forecast or guarantee of returns.
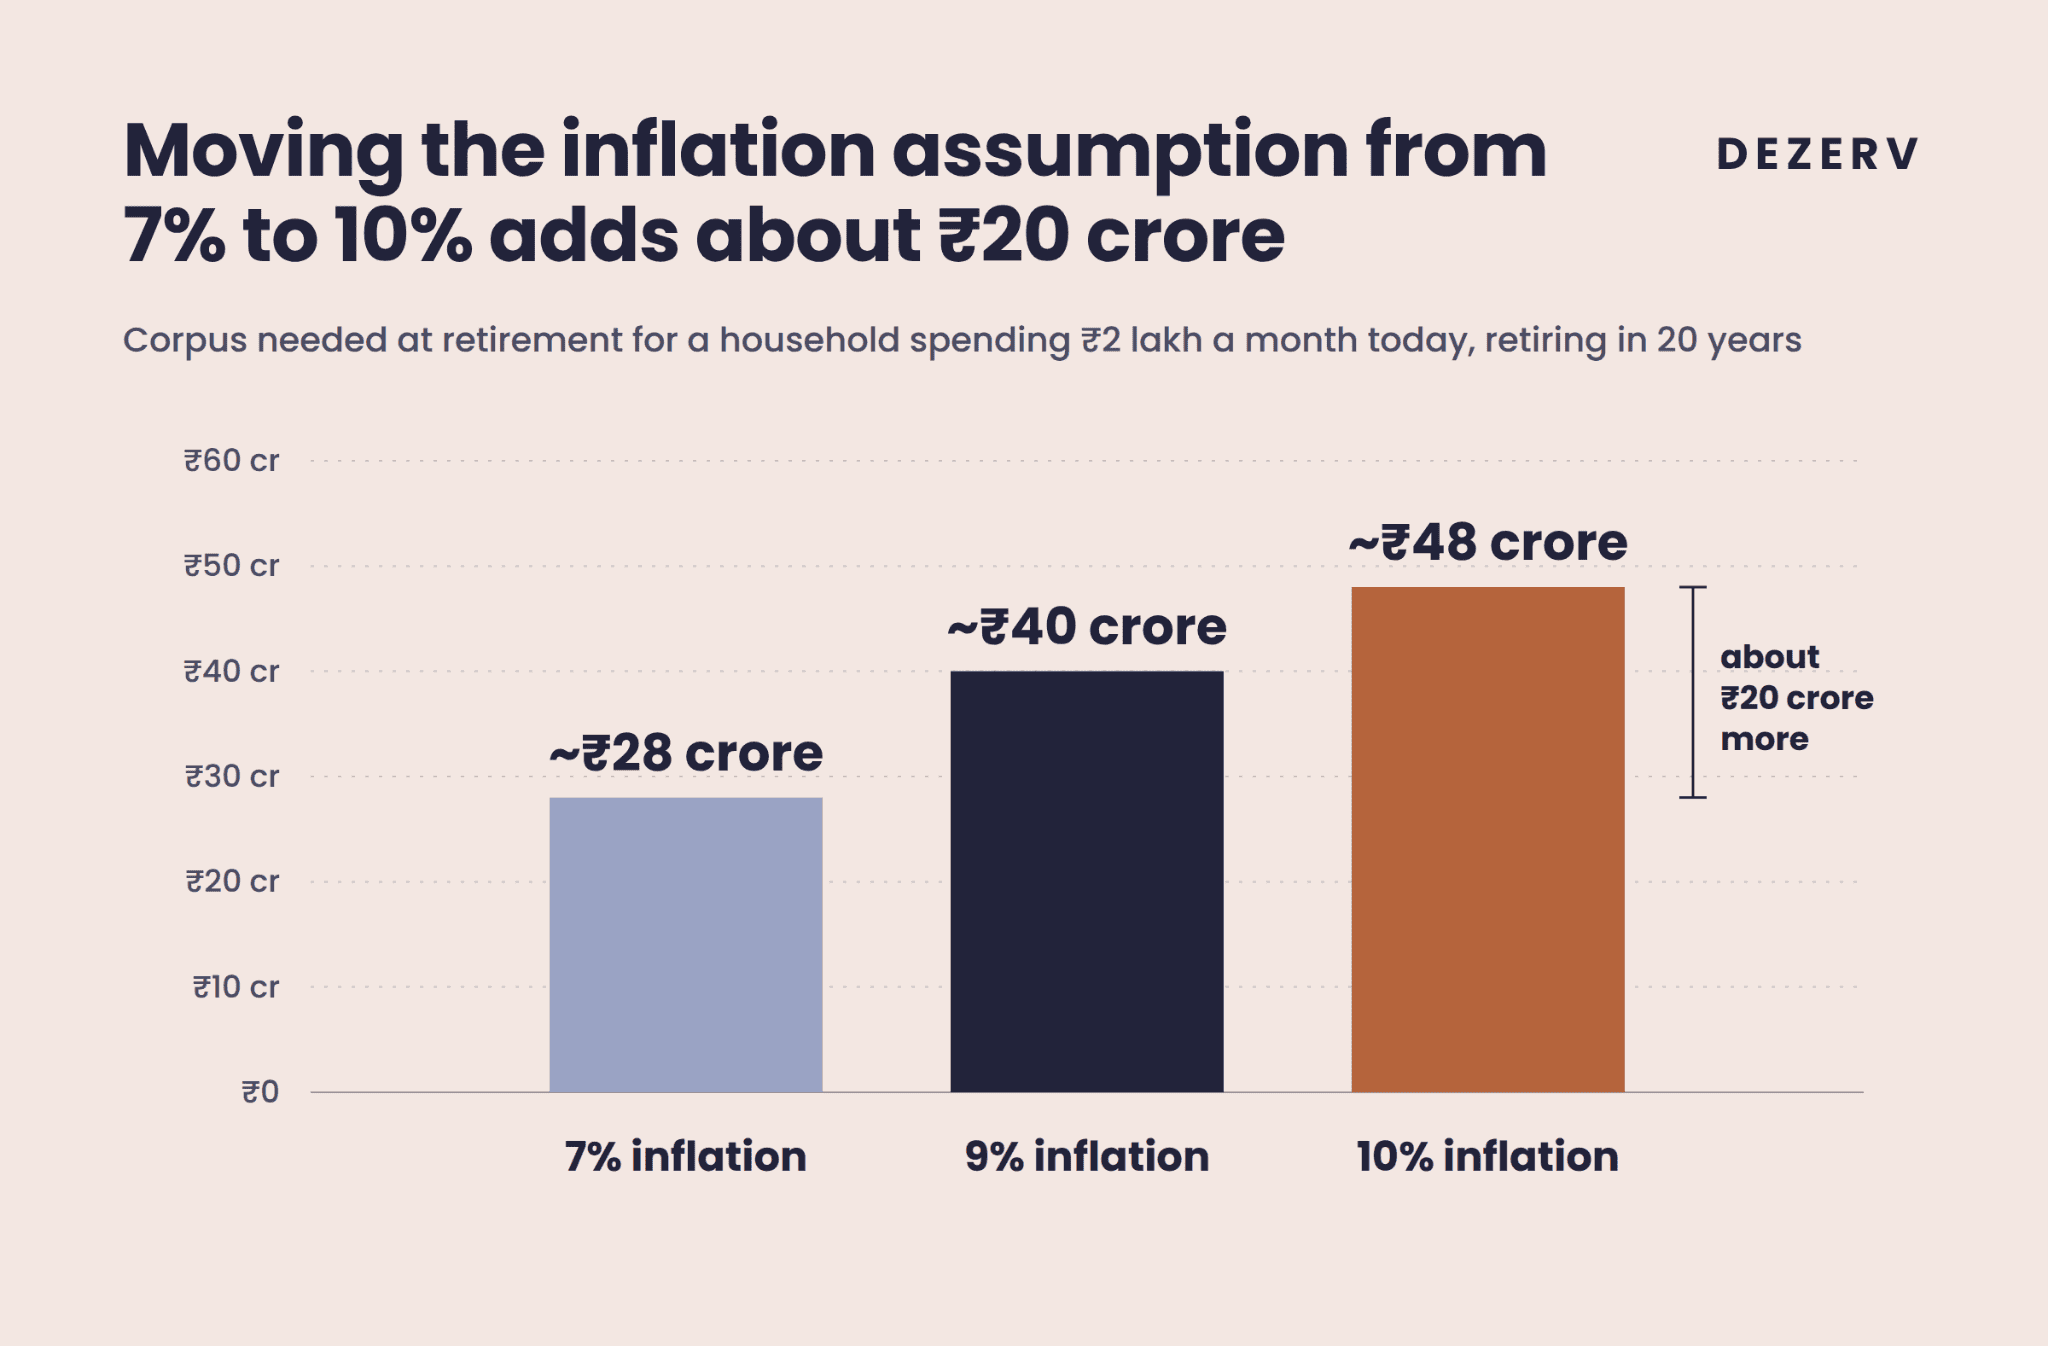
Moving the inflation assumption from 7% to 10% increases the required corpus by about ₹20 crore, even though the household is trying to fund exactly the same lifestyle.
That is how much weight one assumption can carry.
There is another reason these corpus numbers look so large: they are expressed in future rupees.
For mathematical illustration only, using the article’s sample assumption of about 12% post-tax growth over the 20 years to retirement, the ₹40 crore required at 9% inflation would correspond to roughly ₹4.2 crore today under that return assumption. The ₹48 crore required at 10% would correspond to roughly ₹5 crore.
Note: This assumed rate is used only for illustration and is not representative of any Dezerv strategy, asset class or expected investor return.
These are sample calculations based on the stated assumptions, not forecasts or guaranteed outcomes.
The future corpus and the amount required today answer different questions. The present-day figure depends directly on the assumed pre-retirement return.
Want to test different assumptions for your retirement? Use the Dezerv Retirement Calculator.
Which categories can see faster price increases
Not every part of a household budget rises at the same pace.
Some categories that can form a meaningful share of spending for a wealthier household have historically seen faster price increases:
- Healthcare: According to ICICI Lombard, medical costs are estimated to be rising at around12–14% a year and are discussed separately below.
- Domestic help and services: These costs can rise faster than headline CPI.
- Education, travel and leisure: These costs can rise faster than general inflation.Kotak Mutual Fund cites education inflation in India at around 10–12% annually, whileSCMP notes inflationary pressure on travel costs, including from higher fuel prices.
- Staples and utilities: These tend to sit closer to the broader headline range tracked byMoSPI.
The weighting matters.
If faster-rising categories account for a greater share of your household budget, your personal inflation rate can end up above headline CPI.
The calculation above simplifies the problem by holding the lifestyle constant. In reality, over long periods, the spending basket itself can change.
What once counted as conveyance might have meant a bus or train pass. A generation later, the same part of a household budget may include a car, cabs and annual flights.
Retirement planning therefore has to account not only for the price of today’s basket, but also for how that basket may evolve over time.
How to inflation-proof a retirement portfolio
You cannot control what inflation will be twenty years from now.
What you can think about is whether the assets funding your retirement have historically had the ability to grow faster than inflation over long periods.
That matters because depending on prevailing interest rates and an investor’s applicable tax treatment, cash and fixed deposits may not keep pace with an illustrative 9% lifestyle-inflation assumption
Instead of thinking only in terms of a fixed return number, another way to frame long-term expectations is to consider the return an asset class has historically generated over and above inflation.
Historical returns relative to inflation
For 10-to-15-year horizons. Historical framing as on 30 June 2026; not a promise of future returns.
| Asset class | Historical return premium observed |
| Equity | Inflation + 4–6% |
| Gold | Inflation + 2–4% |
| Real estate | Inflation + 2–4% |
| High-quality debt | Inflation + 1–2% |
Historical observations relative to inflation; these premiums are not forecasts or expected future returns, and past performance may not be sustained. Sources:NSE / Nifty Indices,LBMA,NHB Residex, RBI / Income Tax Department; as on 30 June 2026.
The historical record provides context for these assumptions.
Over the past 20 years, the Nifty 50 Total Return Index (TRI) compounded at about 12% a year, gold in rupee terms at about 13.9%, residential real estate based on the NHB Residex at around 7.9%, and a high-quality debt blend at around 7.6%.
Over the historical periods analysed by Dezerv, equities and gold have at times generated returns above inflation. The extent of this premium varies materially by period.
That does not mean these premiums will repeat. They vary across periods, and none is guaranteed.
But it does explain why retirement portfolios are generally built around more than cash. Over a retirement that may last 30 years, preserving purchasing power matters alongside preserving capital.
Diversification across assets with different characteristics can help spread the risks involved rather than leaving the retirement corpus dependent on any single source of return.
In their words
“Diversification is the only free lunch in investing.”
— Harry Markowitz, Nobel laureate in Economics
Healthcare inflation is a separate force
Healthcare deserves to be treated differently from general lifestyle inflation.
Medical costs are estimated to be rising at roughly 12–14% a year, well above the general inflation basket.
More importantly, healthcare can become a larger share of household spending with age, precisely when earned income may have stopped.
That makes it difficult to capture adequately by simply folding healthcare into one general inflation assumption.
A retirement plan may therefore need to model healthcare expenditure separately, with its own assumptions and provision, rather than expecting the regular household budget to absorb it.
The dedicated healthcare corpus article looks at this expense separately.
Key takeaways
- Inflation is one of the most important inputs in a retirement calculation. Underestimating it can materially reduce the corpus you appear to need.
- Headline CPI may not match the inflation experienced by an individual household. A spending basket with greater exposure to healthcare, domestic help, education, travel and leisure may behave differently.
- The 8–9% lifestyle-inflation range used in Dezerv’s analysis is an estimate for the spending basket described in this article, not an official inflation statistic or a rate that applies to every household.
- Small differences compound. In the sample scenario above, moving from 7% to 10% inflation changes the estimated retirement corpus by about ₹20 crore.
- Not every part of your lifestyle inflates at the same rate. Healthcare, domestic help and education can behave differently from staples and utilities.
- Purchasing power matters after retirement too. Growth assets such as equity and gold have historically outpaced inflation over long periods, while cash and fixed deposits may not always keep pace with a 9% lifestyle-inflation assumption after tax. Past performance may not be sustained.
- Test your own inflation assumption in the Dezerv Retirement Calculator.
You can also speak to a Dezerv Expert to work through your retirement assumptions and corpus requirement.Book a call today.
Frequently Asked Questions
How does inflation affect retirement planning?
Inflation raises the amount you may need by the time you retire and continues to reduce the purchasing power of your corpus after retirement.
Over a 30-year retirement, compounding can materially change what the same amount of money buys. A retirement plan therefore needs to account for prices continuing to rise even after earned income stops.
Using an inflation assumption that is too low can lead to an underestimate of the retirement corpus required.
What inflation rate should I use for retirement planning in India?
There is no single inflation rate that will describe every household equally well.
Headline CPI is a useful measure of economy-wide inflation, but an individual household may have a different spending mix.
For the spending basket described in this article, which includes categories such as healthcare, domestic help, education, travel and leisure, Dezerv estimates blended lifestyle inflation at roughly 8–9% over time.
This is a Dezerv estimate based on multiple expense-category data points, not an official inflation statistic or a rate that applies to every household. The appropriate assumption will depend on the expenses that make up your own lifestyle.
Why can my personal inflation be higher than the CPI?
CPI tracks a nationally averaged basket of goods and services. A household may spend a larger share of its budget on categories that can see faster price increases. For example, private healthcare costs have been estimated at around 12–14% annually, whileKotak Mutual Fund cites education inflation in India at around 10–12%.SCMP also points to inflationary pressure on travel costs, including from higher fuel prices.
The greater the weight of faster-rising categories in your spending basket, the higher your blended inflation rate can be.
Can investing beat inflation in retirement?
Historically, some growth assets have compounded ahead of inflation over long periods.
Over the 20-year period referenced in this article, theNifty 50 TRI compounded at about 12% a year and gold in rupee terms at about 13.9%, based onLBMA data, while cash and fixed deposits alone may trail a 9% lifestyle-inflation assumption after tax.
Diversification across equity, high-quality debt and gold can help reduce reliance on any single source of return, because these asset classes behave differently across market and inflation cycles.
Returns are not guaranteed and past performance does not indicate future results.
Disclaimer
Dezerv Investments Private Limited (DIPL) is a Portfolio Manager with SEBI Registration no. INP000007377. Distribution services are offered through Dezerv Distribution Services Private Limited, a wholly owned subsidiary of DIPL (collectively referred to as "Dezerv") vide AMFI Registration No. (ARN)-248439 and APMI registration no. (APRN)-00615. This article is intended solely for general educational and informational purposes and should not be construed as personalised investment, financial planning, tax or legal advice, or as a recommendation, offer or solicitation to invest in any security, financial product or investment strategy.
Readers are advised to consult with their financial advisor before making investment decisions based on the information provided herein.
The calculations, illustrations, estimates and assumptions herein are for illustrative purposes only and do not represent actual or expected costs, returns or outcomes. Any corpus, inflation or return figures shown are illustrative and are not forecasts, expected outcomes or guaranteed returns. Actual outcomes may vary based on individual circumstances and prevailing market, economic, healthcare, insurance, tax and regulatory conditions.
Certain estimates and calculations in this article are based on analysis by the Dezerv Investment Team and are identified as such where relevant. Such estimates are not official statistics and may not apply to every household or investor.
In preparing this material, Dezerv has used publicly available information and other sources believed to be reliable. While reasonable care has been taken, Dezerv does not guarantee the accuracy or completeness of the information. The information is not a complete disclosure of all material facts, terms or conditions and should not be relied upon independently for developing or implementing an investment strategy. Dezerv and its affiliates shall not be liable for any loss or damage arising from its use.
Investment in the securities market is subject to market risks. Please read all related documents carefully before investing. Past performance, where referred to, is not indicative of future performance.


