



Fund Overview

Fund Size
₹5,819 Cr

Expense Ratio
2.12%

ISIN
INF769K01NG0

Minimum SIP
₹1,000

Exit Load
1.00%

Inception Date
31 Jan 2025
About this fund
As of 30-Oct-26, it has a Net Asset Value (NAV) of ₹11.63, Assets Under Management (AUM) of 5819.32 Crores, and an expense ratio of 2.12%.
- Mirae Asset Small Cap Fund Regular Growth has given a CAGR return of 9.07% since inception.
- The fund's asset allocation comprises around 98.75% in equities, 0.00% in debts, and 1.25% in cash & cash equivalents.
- You can start investing in Mirae Asset Small Cap Fund Regular Growth with a SIP of ₹1000 or a Lumpsum investment of ₹5000.
Performance against Category Average
In this section, we compare the returns of the scheme with the category average over various periods. Periods for which the fund has outperformed its category average are marked in green, otherwise red.
1 Year
-1.81%
+3.35% (Cat Avg.)
Since Inception
+9.07%
— (Cat Avg.)
Portfolio Summaryas of 30th September 2026
| Equity | ₹5,746.39 Cr | 98.75% |
| Others | ₹72.93 Cr | 1.25% |
Top Holdings
All Holdings
Equity
Debt & Others
| Name | Type  | Amount | Holdings |
|---|---|---|---|
| Welspun Corp Ltd | Equity | ₹166.58 Cr | 2.86% |
| Treps | Cash - Repurchase Agreement | ₹164.36 Cr | 2.82% |
| Kirloskar Oil Engines Ltd | Equity | ₹147.47 Cr | 2.53% |
| Bluestone Jewellery And Lifestyle Ltd | Equity | ₹135.32 Cr | 2.33% |
| Dr. Lal PathLabs Ltd | Equity | ₹133.69 Cr | 2.30% |
| Karur Vysya Bank Ltd | Equity | ₹124.6 Cr | 2.14% |
| GNG Electronics Ltd | Equity | ₹109.75 Cr | 1.89% |
| K.P.R. Mill Ltd | Equity | ₹109.35 Cr | 1.88% |
| Kusumgar Ltd | Equity | ₹109.23 Cr | 1.88% |
| Voltamp Transformers Ltd | Equity | ₹108.65 Cr | 1.87% |
| Gland Pharma Ltd | Equity | ₹107.48 Cr | 1.85% |
| Anthem Biosciences Ltd | Equity | ₹106.63 Cr | 1.83% |
| Atul Ltd | Equity | ₹104.8 Cr | 1.80% |
| Neuland Laboratories Ltd | Equity | ₹103.58 Cr | 1.78% |
| Timken India Ltd | Equity | ₹99.43 Cr | 1.71% |
| NLC India Ltd | Equity | ₹99.38 Cr | 1.71% |
| Cholamandalam Financial Holdings Ltd | Equity | ₹98.52 Cr | 1.69% |
| Krishna Institute of Medical Sciences Ltd | Equity | ₹98.15 Cr | 1.69% |
| DOMS Industries Ltd | Equity | ₹96.32 Cr | 1.66% |
| Godawari Power & Ispat Ltd | Equity | ₹94.69 Cr | 1.63% |
| Kanohar Electricals Ltd | Equity | ₹93.35 Cr | 1.60% |
| DCB Bank Ltd | Equity | ₹92.98 Cr | 1.60% |
| JK Cement Ltd | Equity | ₹92.96 Cr | 1.60% |
| Tenneco Clean Air India Ltd | Equity | ₹92.62 Cr | 1.59% |
| Net Receivables / (Payables) | Cash | ₹-91.42 Cr | 1.57% |
| Multi Commodity Exchange of India Ltd | Equity | ₹88.92 Cr | 1.53% |
| CRISIL Ltd | Equity | ₹88.72 Cr | 1.52% |
| Phoenix Mills Ltd | Equity | ₹85.62 Cr | 1.47% |
| Coromandel International Ltd | Equity | ₹85.3 Cr | 1.47% |
| eClerx Services Ltd | Equity | ₹84.01 Cr | 1.44% |
| Torrent Pharmaceuticals Ltd | Equity | ₹83.51 Cr | 1.44% |
| Delhivery Ltd | Equity | ₹82.35 Cr | 1.42% |
| Triveni Turbine Ltd | Equity | ₹77.54 Cr | 1.33% |
| Central Depository Services (India) Ltd | Equity | ₹77.36 Cr | 1.33% |
| Equitas Small Finance Bank Ltd Ordinary Shares | Equity | ₹75 Cr | 1.29% |
| Kalpataru Projects International Ltd | Equity | ₹73.2 Cr | 1.26% |
| Home First Finance Co India Ltd | Equity | ₹71.18 Cr | 1.22% |
| Sagility Ltd | Equity | ₹70.54 Cr | 1.21% |
| City Union Bank Ltd | Equity | ₹69.04 Cr | 1.19% |
| Narayana Hrudayalaya Ltd | Equity | ₹67.85 Cr | 1.17% |
| Mankind Pharma Ltd | Equity | ₹67.01 Cr | 1.15% |
| Aditya Infotech Ltd | Equity | ₹66.57 Cr | 1.14% |
| Canara HSBC Life Insurance Co Ltd | Equity | ₹64.98 Cr | 1.12% |
| Elgi Equipments Ltd | Equity | ₹64.8 Cr | 1.11% |
| Craftsman Automation Ltd | Equity | ₹64.35 Cr | 1.11% |
| Fine Organic Industries Ltd Ordinary Shares | Equity | ₹62.58 Cr | 1.08% |
| L&T Finance Ltd | Equity | ₹61.59 Cr | 1.06% |
| Motherson Sumi Wiring India Ltd | Equity | ₹59.95 Cr | 1.03% |
| Sai Life Sciences Ltd | Equity | ₹59.52 Cr | 1.02% |
| Symbiotec Pharmalab Ltd | Equity | ₹58.23 Cr | 1.00% |
| KFin Technologies Ltd | Equity | ₹57.42 Cr | 0.99% |
| Mahindra & Mahindra Ltd | Equity | ₹56.84 Cr | 0.98% |
| Computer Age Management Services Ltd Ordinary Shares | Equity | ₹56.43 Cr | 0.97% |
| Sundaram Finance Ltd | Equity | ₹55.28 Cr | 0.95% |
| Indus Towers Ltd Ordinary Shares | Equity | ₹53.37 Cr | 0.92% |
| Cera Sanitaryware Ltd | Equity | ₹53.18 Cr | 0.91% |
| National Stock Exchange of India Ltd | Equity | ₹52.89 Cr | 0.91% |
| Shiprocket Ltd | Equity | ₹52.87 Cr | 0.91% |
| Saatvik Green Energy Ltd | Equity | ₹49.61 Cr | 0.85% |
| Foseco India Ltd | Equity | ₹48.37 Cr | 0.83% |
| Navin Fluorine International Ltd | Equity | ₹48.06 Cr | 0.83% |
| Brigade Enterprises Ltd | Equity | ₹48.01 Cr | 0.83% |
| Lenskart Solutions Ltd | Equity | ₹47.08 Cr | 0.81% |
| Can Fin Homes Ltd | Equity | ₹46.96 Cr | 0.81% |
| Wendt (India) Ltd | Equity | ₹45.71 Cr | 0.79% |
| Safari Industries (India) Ltd | Equity | ₹44.53 Cr | 0.77% |
| Vesuvius India Ltd | Equity | ₹44.35 Cr | 0.76% |
| Wakefit Innovations Ltd | Equity | ₹44.07 Cr | 0.76% |
| Wockhardt Ltd | Equity | ₹42.87 Cr | 0.74% |
| Sapphire Foods India Ltd | Equity | ₹40.69 Cr | 0.70% |
| CG Power & Industrial Solutions Ltd | Equity | ₹40.27 Cr | 0.69% |
| Laser Power & Infra Ltd | Equity | ₹39.23 Cr | 0.67% |
| CARE Ratings Ltd | Equity | ₹37.7 Cr | 0.65% |
| Blackbuck Ltd | Equity | ₹35.26 Cr | 0.61% |
| Billionbrains Garage Ventures Ltd | Equity | ₹32.34 Cr | 0.56% |
| Molbio Diagnostics Ltd | Equity | ₹31.81 Cr | 0.55% |
| Transport Corp of India Ltd | Equity | ₹31.28 Cr | 0.54% |
| Sobha Ltd | Equity | ₹30.01 Cr | 0.52% |
| Eternal Ltd | Equity | ₹28.82 Cr | 0.50% |
| SJS Enterprises Ltd | Equity | ₹27.19 Cr | 0.47% |
| Century Plyboards (India) Ltd | Equity | ₹18.92 Cr | 0.33% |
| TVS Motor Co Ltd | Equity | ₹17.05 Cr | 0.29% |
| JSW Infrastructure Ltd | Equity | ₹14.72 Cr | 0.25% |
| Indigo Paints Ltd Ordinary Shares | Equity | ₹13.73 Cr | 0.24% |
| Orient Electric Ltd Ordinary Shares | Equity | ₹11.89 Cr | 0.20% |
| Diamond Power Infrastructure Ltd | Equity | ₹11.89 Cr | 0.20% |
| Moneyview Ltd | Equity | ₹0.42 Cr | 0.01% |
Allocation By Market Cap (Equity)
Large Cap Stocks
5.37%
Mid Cap Stocks
14.99%
Small Cap Stocks
70.86%
Other Allocation
Equity Sector
Debt & Others
| Sector | Amount | Holdings |
|---|---|---|
| Industrials | ₹1,190.33 Cr | 20.45% |
| Financial Services | ₹1,138.07 Cr | 19.56% |
| Healthcare | ₹1,077.95 Cr | 18.52% |
| Consumer Cyclical | ₹841.89 Cr | 14.47% |
| Basic Materials | ₹736 Cr | 12.65% |
| Technology | ₹445.77 Cr | 7.66% |
| Real Estate | ₹163.65 Cr | 2.81% |
| Utilities | ₹99.38 Cr | 1.71% |
| Communication Services | ₹53.37 Cr | 0.92% |
Risk & Performance Ratios
Standard Deviation
This fund
--
Cat. avg.
19.80%
Lower the better
Sharpe Ratio
This fund
--
Cat. avg.
0.48
Higher the better
Sortino Ratio
This fund
--
Cat. avg.
0.78
Higher the better
Fund Managers
Varun Goel
Since January 2025
Additional Scheme Detailsas of 30th September 2026
ISIN INF769K01NG0 | Expense Ratio 2.12% | Exit Load 1.00% | Fund Size ₹5,819 Cr | Age 1 year 9 months | Lumpsum Minimum ₹5,000 | Fund Status Open Ended Investment Company | Benchmark Nifty Smallcap 250 TR INR |
 Investment Objective
To seek to generate long-term capital growth from an actively managed portfolio primarily of Equity and Equity Related Securities. Scheme shall invest in Indian equities,foreign equities and related instruments and debt securities.
Tax Treatment
 Capital Gains Taxation:
 Dividend Taxation:

Note: As per the Income Tax Budget 2024, mutual funds are subject to capital gains taxation, which includes surcharge and cess based on prevailing income tax rules and the investor’s income. Taxation applies only to realised gains, not notional gains. Please consult your tax advisors to determine the implications or consequences of your investments in such securities.
Similar Small-Cap Funds

About the AMC

Mirae Asset India Mutual Fund


Total AUM
₹2,50,281 Cr
Address
Unit No. 606, 6th Floor, Mumbai, 400 098
Other Funds by Mirae Asset India Mutual Fund
Risk Level
Your principal amount will be at Very High Risk

Take control of your wealth



Related Articles


Still got questions?
We're here to help.
What is the current NAV of Mirae Asset Small Cap Fund Regular Growth?

What is the portfolio composition of Mirae Asset Small Cap Fund Regular Growth?

Who manages the Mirae Asset Small Cap Fund Regular Growth?
- Varun Goel
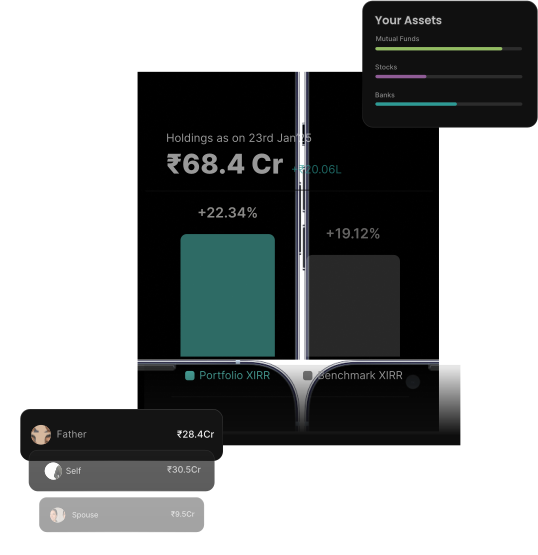
Track & Analyse all your investments in one place

Compare your portfolio's performance with benchmarks
Identify potential risks in your portfolio and learn to fix them
Track all your family's investments in one place

Trending Mutual Funds Searches

Popular Equity Funds
Popular Debt Funds


Dezerv Investments Pvt. Ltd. is a Portfolio Manager with SEBI Registration no. INP000007377, a member of BSE with SEBI Stock Broker Registration no. INZ000303136, and an Investment Manager to Category - I AIF-VCF-Angel Fund with SEBI Registration no. IN/AIF1/22-23/1066.
Mutual Fund distribution services are offered through Dezerv Distribution Services Pvt Limited, a wholly owned subsidiary with AMFI Registration No.: ARN -248439. **Mutual fund investments are subject to market risks, read all scheme related documents carefully.** Terms and conditions of the website are applicable. Privacy policy of the website is applicable.

