
HDFC Nifty 100 Index Fund Regular Growth
EquityIndex FundsVery High Risk
Regular

NAV (13-Oct-26)
Returns (Since Inception)



Fund Overview

Fund Size
₹457 Cr

Expense Ratio
0.81%

ISIN
INF179KC1BZ0

Minimum SIP
₹100

Exit Load
No Charges

Inception Date
23 Feb 2022
About this fund
As of 13-Oct-26, it has a Net Asset Value (NAV) of ₹13.88, Assets Under Management (AUM) of 457.03 Crores, and an expense ratio of 0.81%.
- HDFC Nifty 100 Index Fund Regular Growth has given a CAGR return of 7.36% since inception.
- The fund's asset allocation comprises around 100.07% in equities, 0.00% in debts, and -0.07% in cash & cash equivalents.
- You can start investing in HDFC Nifty 100 Index Fund Regular Growth with a SIP of ₹100 or a Lumpsum investment of ₹100.
Performance against Category Average
In this section, we compare the returns of the scheme with the category average over various periods. Periods for which the fund has outperformed its category average are marked in green, otherwise red.
1 Year
-7.88%
— (Cat Avg.)
3 Years
+6.78%
— (Cat Avg.)
Since Inception
+7.36%
— (Cat Avg.)
Portfolio Summaryas of 30th September 2026
| Equity | ₹457.37 Cr | 100.07% |
| Others | ₹-0.33 Cr | -0.07% |
Top Holdings
All Holdings
Equity
Debt & Others
| Name | Type  | Amount | Holdings |
|---|---|---|---|
| HDFC Bank Ltd | Equity | ₹38.49 Cr | 8.42% |
| ICICI Bank Ltd | Equity | ₹33.57 Cr | 7.35% |
| Reliance Industries Ltd | Equity | ₹28.12 Cr | 6.15% |
| Bharti Airtel Ltd | Equity | ₹18.93 Cr | 4.14% |
| Larsen & Toubro Ltd | Equity | ₹15.6 Cr | 3.41% |
| State Bank of India | Equity | ₹14.05 Cr | 3.07% |
| Axis Bank Ltd | Equity | ₹12.49 Cr | 2.73% |
| Infosys Ltd | Equity | ₹12.44 Cr | 2.72% |
| Kotak Mahindra Bank Ltd | Equity | ₹10.88 Cr | 2.38% |
| Mahindra & Mahindra Ltd | Equity | ₹9.34 Cr | 2.04% |
| Bajaj Finance Ltd | Equity | ₹9.28 Cr | 2.03% |
| ITC Ltd | Equity | ₹8.98 Cr | 1.96% |
| Eternal Ltd | Equity | ₹8.22 Cr | 1.80% |
| Tata Consultancy Services Ltd | Equity | ₹7.42 Cr | 1.62% |
| Sun Pharmaceuticals Industries Ltd | Equity | ₹6.82 Cr | 1.49% |
| Titan Co Ltd | Equity | ₹6.72 Cr | 1.47% |
| Hindustan Unilever Ltd | Equity | ₹5.91 Cr | 1.29% |
| Maruti Suzuki India Ltd | Equity | ₹5.51 Cr | 1.21% |
| NTPC Ltd | Equity | ₹5.43 Cr | 1.19% |
| Tata Steel Ltd | Equity | ₹5.42 Cr | 1.19% |
| Adani Ports & Special Economic Zone Ltd | Equity | ₹4.99 Cr | 1.09% |
| Bharat Electronics Ltd | Equity | ₹4.93 Cr | 1.08% |
| Shriram Finance Ltd | Equity | ₹4.88 Cr | 1.07% |
| Hindalco Industries Ltd | Equity | ₹4.83 Cr | 1.06% |
| UltraTech Cement Ltd | Equity | ₹4.59 Cr | 1.01% |
| HCL Technologies Ltd | Equity | ₹4.59 Cr | 1.00% |
| BSE Ltd | Equity | ₹4.41 Cr | 0.97% |
| JSW Steel Ltd | Equity | ₹4.28 Cr | 0.94% |
| Bajaj Auto Ltd | Equity | ₹4.2 Cr | 0.92% |
| Divi's Laboratories Ltd | Equity | ₹4.18 Cr | 0.92% |
| Power Grid Corp Of India Ltd | Equity | ₹4.18 Cr | 0.91% |
| Grasim Industries Ltd | Equity | ₹4.09 Cr | 0.90% |
| InterGlobe Aviation Ltd | Equity | ₹4 Cr | 0.87% |
| Asian Paints Ltd | Equity | ₹3.85 Cr | 0.84% |
| Coal India Ltd | Equity | ₹3.61 Cr | 0.79% |
| Bajaj Finserv Ltd | Equity | ₹3.57 Cr | 0.78% |
| Eicher Motors Ltd | Equity | ₹3.49 Cr | 0.76% |
| Adani Enterprises Ltd | Equity | ₹3.49 Cr | 0.76% |
| Tech Mahindra Ltd | Equity | ₹3.43 Cr | 0.75% |
| TVS Motor Co Ltd | Equity | ₹3.42 Cr | 0.75% |
| Nestle India Ltd | Equity | ₹3.33 Cr | 0.73% |
| Hindustan Aeronautics Ltd Ordinary Shares | Equity | ₹3.14 Cr | 0.69% |
| Tata Motors Ltd | Equity | ₹3.12 Cr | 0.68% |
| Oil & Natural Gas Corp Ltd | Equity | ₹3.11 Cr | 0.68% |
| Trent Ltd | Equity | ₹3.09 Cr | 0.68% |
| Adani Power Ltd | Equity | ₹3.01 Cr | 0.66% |
| Apollo Hospitals Enterprise Ltd | Equity | ₹2.98 Cr | 0.65% |
| SBI Life Insurance Co Ltd | Equity | ₹2.7 Cr | 0.59% |
| Cipla Ltd | Equity | ₹2.68 Cr | 0.59% |
| Dr Reddy's Laboratories Ltd | Equity | ₹2.66 Cr | 0.58% |
| Samvardhana Motherson International Ltd | Equity | ₹2.56 Cr | 0.56% |
| Jio Financial Services Ltd | Equity | ₹2.52 Cr | 0.55% |
| Torrent Pharmaceuticals Ltd | Equity | ₹2.5 Cr | 0.55% |
| Cholamandalam Investment and Finance Co Ltd | Equity | ₹2.49 Cr | 0.54% |
| Vedanta Aluminium Metal Ltd | Equity | ₹2.45 Cr | 0.54% |
| Max Healthcare Institute Ltd Ordinary Shares | Equity | ₹2.45 Cr | 0.54% |
| Cummins India Ltd | Equity | ₹2.28 Cr | 0.50% |
| Tata Consumer Products Ltd | Equity | ₹2.19 Cr | 0.48% |
| Avenue Supermarts Ltd | Equity | ₹2.17 Cr | 0.48% |
| Bharat Petroleum Corp Ltd | Equity | ₹2.16 Cr | 0.47% |
| Tata Power Co Ltd | Equity | ₹2.14 Cr | 0.47% |
| Tata Motors Passenger Vehicles Ltd | Equity | ₹2.1 Cr | 0.46% |
| Varun Beverages Ltd | Equity | ₹2.09 Cr | 0.46% |
| CG Power & Industrial Solutions Ltd | Equity | ₹2.08 Cr | 0.45% |
| Britannia Industries Ltd | Equity | ₹2.02 Cr | 0.44% |
| HDFC Life Insurance Co Ltd | Equity | ₹1.99 Cr | 0.43% |
| Indian Oil Corp Ltd | Equity | ₹1.79 Cr | 0.39% |
| Solar Industries India Ltd | Equity | ₹1.7 Cr | 0.37% |
| Power Finance Corp Ltd | Equity | ₹1.68 Cr | 0.37% |
| Bajaj Holdings and Investment Ltd | Equity | ₹1.65 Cr | 0.36% |
| HDFC Asset Management Co Ltd | Equity | ₹1.65 Cr | 0.36% |
| GAIL (India) Ltd | Equity | ₹1.63 Cr | 0.36% |
| Vedanta Ltd | Equity | ₹1.62 Cr | 0.35% |
| Pidilite Industries Ltd | Equity | ₹1.61 Cr | 0.35% |
| Net Current Assets | Cash | ₹-1.59 Cr | 0.35% |
| DLF Ltd | Equity | ₹1.53 Cr | 0.34% |
| Polycab India Ltd | Equity | ₹1.53 Cr | 0.33% |
| Wipro Ltd | Equity | ₹1.52 Cr | 0.33% |
| Adani Energy Solutions Ltd | Equity | ₹1.52 Cr | 0.33% |
| Adani Green Energy Ltd | Equity | ₹1.52 Cr | 0.33% |
| Bank of Baroda | Equity | ₹1.52 Cr | 0.33% |
| Jindal Steel Ltd | Equity | ₹1.49 Cr | 0.33% |
| Bosch Ltd | Equity | ₹1.45 Cr | 0.32% |
| Canara Bank | Equity | ₹1.42 Cr | 0.31% |
| Hitachi Energy India Ltd Ordinary Shares | Equity | ₹1.39 Cr | 0.30% |
| Punjab National Bank | Equity | ₹1.38 Cr | 0.30% |
| LTM Ltd | Equity | ₹1.33 Cr | 0.29% |
| Vodafone Idea Ltd | Equity | ₹1.27 Cr | 0.28% |
| ABB India Ltd | Equity | ₹1.26 Cr | 0.28% |
| Treps - Tri-Party Repo | Cash - Repurchase Agreement | ₹1.25 Cr | 0.27% |
| Godrej Consumer Products Ltd | Equity | ₹1.21 Cr | 0.26% |
| Union Bank of India | Equity | ₹1.17 Cr | 0.26% |
| Siemens Ltd | Equity | ₹1.17 Cr | 0.26% |
| Muthoot Finance Ltd | Equity | ₹1.04 Cr | 0.23% |
| Hyundai Motor India Ltd | Equity | ₹1.02 Cr | 0.22% |
| Zydus Lifesciences Ltd | Equity | ₹1.02 Cr | 0.22% |
| Siemens Energy India Ltd | Equity | ₹1 Cr | 0.22% |
| Hindustan Zinc Ltd | Equity | ₹0.96 Cr | 0.21% |
| Ambuja Cements Ltd | Equity | ₹0.83 Cr | 0.18% |
| Tata Capital Ltd | Equity | ₹0.64 Cr | 0.14% |
| Indian Railway Finance Corp Ltd Ordinary Shares | Equity | ₹0.63 Cr | 0.14% |
| Mazagon Dock Shipbuilders Ltd | Equity | ₹0.57 Cr | 0.12% |
Allocation By Market Cap (Equity)
Large Cap Stocks
98.07%
Mid Cap Stocks
2.00%
Small Cap Stocks
--
Other Allocation
Equity Sector
Debt & Others
| Sector | Amount | Holdings |
|---|---|---|
| Financial Services | ₹154.1 Cr | 33.72% |
| Consumer Cyclical | ₹54.25 Cr | 11.87% |
| Industrials | ₹42.92 Cr | 9.39% |
| Energy | ₹42.27 Cr | 9.25% |
| Basic Materials | ₹37.73 Cr | 8.25% |
| Technology | ₹30.73 Cr | 6.72% |
| Consumer Defensive | ₹27.9 Cr | 6.10% |
| Healthcare | ₹25.3 Cr | 5.54% |
| Utilities | ₹20.43 Cr | 4.47% |
| Communication Services | ₹20.21 Cr | 4.42% |
| Real Estate | ₹1.53 Cr | 0.34% |
Risk & Performance Ratios
Standard Deviation
This fund
14.89%
Cat. avg.
--
Lower the better
Sharpe Ratio
This fund
0.11
Cat. avg.
--
Higher the better
Sortino Ratio
This fund
--
Cat. avg.
--
Higher the better
Fund Managers
Arun Agarwal
Since March 2022
Nandita Menezes
Since March 2025
Additional Scheme Detailsas of 30th September 2026
ISIN INF179KC1BZ0 | Expense Ratio 0.81% | Exit Load No Charges | Fund Size ₹457 Cr | Age 4 years 7 months | Lumpsum Minimum ₹100 | Fund Status Open Ended Investment Company | Benchmark Nifty 100 TR INR |
 Investment Objective
To seek to generate long-term capital growth from an actively managed portfolio primarily of Equity and Equity Related Securities. Scheme shall invest in Indian equities,foreign equities and related instruments and debt securities.
Tax Treatment
 Capital Gains Taxation:
 Dividend Taxation:

Note: As per the Income Tax Budget 2024, mutual funds are subject to capital gains taxation, which includes surcharge and cess based on prevailing income tax rules and the investor’s income. Taxation applies only to realised gains, not notional gains. Please consult your tax advisors to determine the implications or consequences of your investments in such securities.
Similar Index Funds Funds

About the AMC
HDFC Mutual Fund


Total AUM
₹9,56,438 Cr
Address
“HUL House”, 2nd Floor, Mumbai, 400 020
Other Funds by HDFC Mutual Fund
Risk Level
Your principal amount will be at Very High Risk

Take control of your wealth



Related Articles


Still got questions?
We're here to help.
What is the current NAV of HDFC Nifty 100 Index Fund Regular Growth?

What are the returns of HDFC Nifty 100 Index Fund Regular Growth?

What is the portfolio composition of HDFC Nifty 100 Index Fund Regular Growth?
Who manages the HDFC Nifty 100 Index Fund Regular Growth?
- Arun Agarwal
- Nandita Menezes
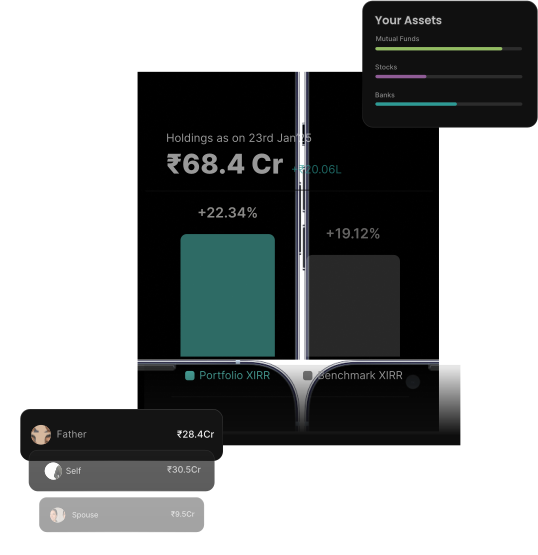
Track & Analyse all your investments in one place

Compare your portfolio's performance with benchmarks
Identify potential risks in your portfolio and learn to fix them
Track all your family's investments in one place

Trending Mutual Funds Searches

Popular Equity Funds
Popular Debt Funds


Dezerv Investments Pvt. Ltd. is a Portfolio Manager with SEBI Registration no. INP000007377, a member of BSE with SEBI Stock Broker Registration no. INZ000303136, and an Investment Manager to Category - I AIF-VCF-Angel Fund with SEBI Registration no. IN/AIF1/22-23/1066.
Mutual Fund distribution services are offered through Dezerv Distribution Services Pvt Limited, a wholly owned subsidiary with AMFI Registration No.: ARN -248439. **Mutual fund investments are subject to market risks, read all scheme related documents carefully.** Terms and conditions of the website are applicable. Privacy policy of the website is applicable.

