
Best retirement plan in India: an honest evaluation framework

Retirement products are often sold using one very comforting word: guaranteed.
It is easy to see why that works. When the income from your salary eventually stops, the idea of knowing exactly what will come into your bank account every month sounds reassuring.
But a retirement plan has a much harder job than simply making your income predictable.
It has to support spending that keeps rising with inflation. It may have to last for decades. You may need access to the money along the way. And a product that feels safe because the payout is fixed can still leave you able to afford less with every passing year.
So perhaps the better question is not, "Which retirement plan is the safest?"
It is: what should a retirement plan actually be judged on?
In short: There is no single best retirement plan in India. The Employees' Provident Fund (EPF), the National Pension System (NPS), pension and annuity plans, mutual funds and portfolio management services (PMS) each solve different parts of the retirement problem. A more useful way to compare them is across five lenses: after-tax real return, liquidity, flexibility, longevity fit and cost. Once you do that, the answer is usually not one winning product but a combination that fits your circumstances.
On this page
- Is there a single best retirement plan, or does it depend?
- What criteria should you judge a retirement plan on?
- Scoring EPF, NPS, pension, mutual funds and PMS
- The best plan by investor profile
- What 'guaranteed' does — and does not — tell you
- How to combine plans rather than pick one
- In their words
- How a PMS may fit into a larger retirement corpus
Is there a single best retirement plan, or does it depend?
It depends, but not in the vague way that phrase is usually used.
Three things can change the answer considerably: how many years you have until retirement, the size of the corpus you are building, and how much of that money you can afford to lock away.
Someone in their 30s with decades before retirement can tolerate a very different portfolio from someone who will begin drawing from it five years from now. A business owner with irregular income may value liquidity differently from a salaried employee whose EPF contributions have been accumulating automatically for years.
That is why picking a retirement plan by product name alone is not particularly useful. The better approach is to judge every option against the same set of questions.
What criteria should you judge a retirement plan on?
We use a five-lens test. Every retirement vehicle can be looked at through these five questions:
- After-tax real return. Does the return beat your own blended inflation after tax? The headline Consumer Price Index (CPI) is only one reference point. A household that spends significantly on private healthcare, domestic help, education and travel can experience a different rate of inflation, because these categories do not necessarily move at the same pace as the overall consumer basket. For our retirement calculations, we use category-level assumptions of healthcare (12–14%) and education/travel (8–10%), blended according to an illustrative affluent-household spending mix; this gives us a planning estimate of roughly 8–9%. These category ranges and the resulting 8–9% estimate are analytical assumptions and are not official inflation statistics. The actual inflation experienced by a household will depend on its individual spending pattern. Under this illustrative 8–9% inflation assumption, a fixed nominal return of 7.1% may not preserve purchasing power over time.
- Liquidity and access. Can you reach the money when you need it, without a lock-in or penalty taking away a meaningful part of the gain?
- Flexibility and control. Can you change the allocation, contribution or exit strategy as your life changes?
- Longevity fit. Is the structure capable of supporting a retirement that could last 30 years, or does the money stop growing too early?
- Cost and tax drag. What does the structure cost you in fees and taxes as the money compounds and eventually gets withdrawn?
The important thing is that these lenses involve trade-offs. A guaranteed pension, for instance, may score very well on certainty while giving up ground on real return and flexibility. There is no product that automatically wins everywhere.
Scoring EPF, NPS, pension, mutual funds and PMS
Applying the five-lens test to the main retirement vehicles in India gives a useful at-a-glance comparison. The ratings below are directional and intended for education, not as a recommendation of any product.
These ratings are directional assessments of broadly diversified retirement-oriented uses of each vehicle category. Actual characteristics may differ materially across individual schemes, products, portfolio mandates and underlying asset allocations.
Note: Actual after-tax returns will depend on the investor's tax position and the applicable tax treatment of the relevant product.
The EPFO Central Board of Trustees recommended an interest rate of 8.25% for FY 2025–26 at its meeting on 2 March 2026, and the Government has since ratified it (PIB, 2 March 2026; ratification reported by PTI, June 2026). PPF pays 7.1% for the July–September 2026 quarter (DEA Office Memorandum F.No.1/4/2019-NS dated 30 June 2026). Both are tax-free, which helps them on cost. But their real return can look very different when compared with an illustrative affluent-household inflation assumption of around 8–9%.
NPS offers low costs and creates investing discipline, although part of the corpus must be annuitised at exit for government and default subscribers.
Annuities, which currently yield roughly 5.5–7.5% a year depending on age, provider and the annuity variant chosen, solve a different problem: they exchange some return potential for greater certainty of income.
Under the assumptions used in this directional comparison, diversified mutual-fund portfolios and multi-asset PMS structures are assessed as offering greater growth potential and flexibility, alongside greater market risk.
The point of the table is not that one row is "best". It is that each product is solving a different part of the retirement equation.
The ideal plan by investor profile
That trade-off becomes easier to see when you look at different kinds of investors.
Salaried saver (25–40). EPF may already provide a retirement savings base through ongoing contributions. Equity-oriented mutual funds can provide market-linked growth exposure, while NPS may offer additional tax benefits depending on the investor's tax regime and circumstances.
Self-employed / business owner (35–50). Without an automatic EPF base, a self-employed investor may need to evaluate separately how to create a stability-oriented component. PPF and NPS are among the options that may be considered for this purpose, alongside market-linked investments such as mutual funds. Liquidity also deserves greater attention when income is uneven.
HNI (₹1 crore-plus investable). At this stage, the problem begins to shift from simply adding more savings to structuring a larger corpus efficiently. A multi-asset PMS or mutual-fund portfolio can be considered alongside EPF and NPS, depending on the investor's liquidity needs, risk appetite and overall retirement structure.
Near-retiree (55–60). The emphasis begins to shift towards protecting near-term spending. That could include reducing risk in the growth portfolio and maintaining a liquidity reserve that may, depending on circumstances, cover several years of expected spending, and then considering whether an annuity has a role in creating a predictable income floor.
What 'guaranteed' does — and does not — tell you
The appeal of a guarantee is obvious. The limitation is that it tells you only one thing about the product.
Traditional insurance-cum-investment plans and many annuities can offer contractually specified or guaranteed payouts, depending on the product terms, but the purchasing power of that payout is what ultimately matters during retirement.
If a fixed return fails to keep pace with inflation over a long period, your income may remain unchanged while everything you need to buy becomes more expensive.
That is why "guaranteed" should be evaluated alongside the other four lenses rather than treated as a complete retirement strategy by itself.
How to combine plans rather than pick one
Once you look at retirement this way, the obsession with finding one perfect product begins to make less sense.
Different assets are good at different things. Equity brings growth potential but volatility. Debt provides greater stability but generally lower growth. Gold behaves differently again. A retirement portfolio can use those differences rather than trying to eliminate them.
The sample scenario below looks at seven combinations of Indian large-cap equity, fixed income and gold across the ten calendar years 2016 to 2025.
A sample scenario of asset-class behaviour, not a Dezerv strategy return or a forecast; past performance may or may not be sustained. Blends of Indian large-cap equity (Nifty 50 Total Return Index), gold (LBMA gold price converted to rupees) and an assumed fixed-income return of 7% a year, rebalanced to the stated weights at the start of each calendar year; ten calendar years, 2016–2025, annualised. Equity returns: NSE Indices (niftyindices.com; Nifty 50 Whitepaper, March 2026, and published full-year 2025 data). Gold: LBMA gold price (monthly average, US dollars) converted at the US Federal Reserve H.10 exchange rate; this tracks the international price of gold in rupee terms and does not include Indian import duty, GST or local premiums, which affect the price of gold bought in India. The 7% debt assumption is a stated modelling assumption; for reference, the Nifty Composite G-sec Index has compounded at 7.56% annually since its January 2011 base date (NSE Indices factsheet, as on 31 August 2026).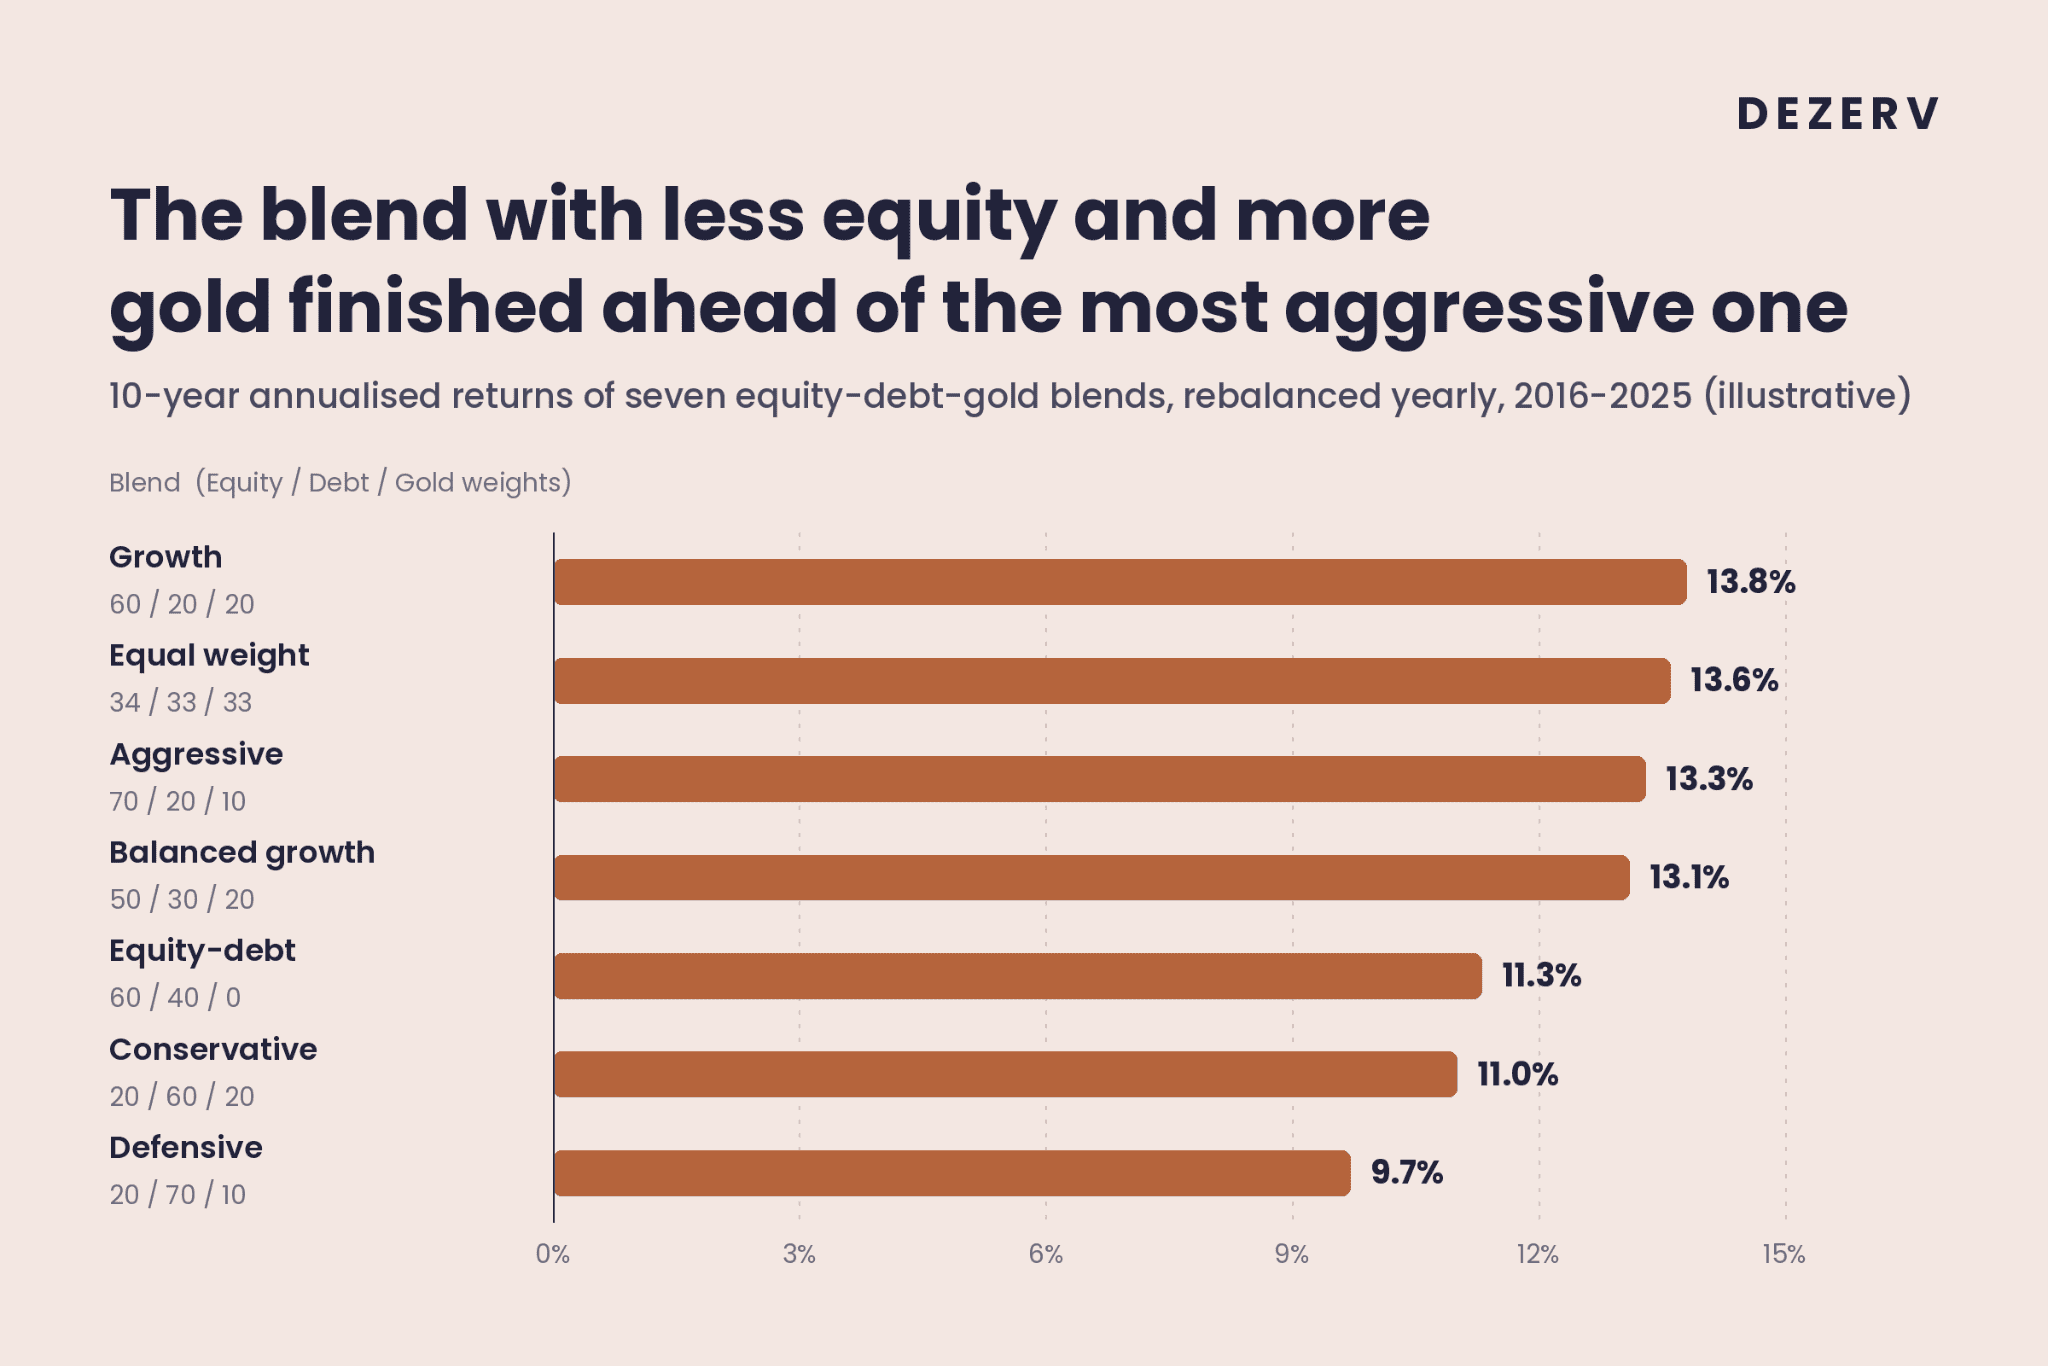
The interesting part is not simply which mix finished first.
The most aggressive blend did not finish first. The growth blend, which held less equity and more gold, ended slightly ahead of it, and the four blends that held all three asset classes finished within one percentage point of each other. Leadership changed along the way, with equity leading in some years and gold in others, yet each of the seven blends produced a positive nominal annualised return over this sample period.
Gold had an unusually strong 2024 and 2025, which flatters every blend that held it in this particular window. A ten-year period ending earlier would rank the blends differently.
For retirement planning, that shifts the emphasis away from repeatedly trying to identify the next winning asset class and towards building a mix you can reasonably stay invested in.
The same problem appears when investors move one level deeper and choose funds based on which one topped the latest performance table.
Across two decades of diversified equity funds ranked on trailing returns, only a minority of top performers remained in the top quartile in the following period.
An analysis of the diversified equity-fund universe ranked on trailing 3-year and 5-year returns, across nineteen 3-year and fifteen 5-year period-pairs, 2002–2025. Aggregate persistence rates only; no individual fund is identified. The underlying fund return data is sourced from the Ace MF database, as on 30 June 2026; Ace MF is the source of the fund return data, not of this analysis. Past performance may or may not be sustained in future.
Roughly three in four top-quartile funds fell out of that quartile over the next three years. Over five years, it was about four in five.
So diversification here is not only about spreading money across asset classes. It is also about avoiding a retirement strategy that depends on repeatedly identifying tomorrow's winner from yesterday's performance table.
In their words
"Diversification is the only free lunch in investing."
— Harry Markowitz, Nobel laureate in economics
How a PMS may fit into a larger retirement corpus
As the corpus becomes larger, managing retirement stops being only a problem of building wealth. The structure of the portfolio starts to matter more too.
A PMS is a SEBI-regulated structure that generally has a minimum investment requirement of ₹50 lakh per client, subject to applicable regulatory exceptions. A PMS may invest, subject to its mandate and applicable regulations, across permitted securities and instruments including equity, debt securities, REITs, InvITs and permitted gold-linked exposures.
For someone approaching or already in retirement, a multi-asset structure can be designed with a greater allocation to debt while retaining exposure to assets such as equity and gold for long-term growth.
A multi-asset PMS can combine growth potential, liquidity and flexibility within one portfolio, with the mix adjusted over time as retirement needs change.
The obvious constraint is size. The ₹50 lakh regulatory minimum is an eligibility constraint rather than a suitability threshold. Even where an investor meets the minimum, the role of PMS will depend on the size of the remaining corpus, liquidity needs, risk profile and overall retirement structure, and on whether that amount can be allocated without compromising the rest of the retirement plan.
To see how this maps to retirement specifically, you can talk to a Dezerv client partner
Key takeaways
- There is no single best retirement plan. The right structure depends on your horizon, corpus size and liquidity requirements.
- Judge retirement vehicles across five lenses: after-tax real return, liquidity, flexibility, longevity fit and cost.
- A guarantee addresses certainty, but retirement planning also has to account for inflation, access to money and long-term growth.
- For many affluent investors, retirement may require a combination of vehicles rather than dependence on any one product.
- Size your own number using the Dezerv Retirement Calculator before choosing the vehicles that will fund it.
Frequently Asked Questions
Which is the best retirement plan in India?
There is no universal best retirement plan. EPF, NPS, pension plans, mutual funds and PMS each behave differently on after-tax real return, liquidity, flexibility, longevity fit and cost. The right combination depends on how much time you have until retirement, the size of the corpus you are building and how much of it you can afford to lock away.
Is NPS better than mutual funds for retirement?
They solve different problems.
NPS has relatively low costs and builds in investing discipline, while annuitisation requirements at exit depend on the subscriber category and the applicable PFRDA exit rules.
Mutual funds can offer a wider range of asset allocations and generally greater withdrawal flexibility, depending on the scheme, while growth potential will depend on the underlying asset mix and market performance, but do not impose the same discipline. An investor may therefore use the two for different parts of the retirement portfolio rather than treating them as direct substitutes.
Is a guaranteed pension plan a good idea?
It can have a role, but that role depends on what you need it to achieve.
A guaranteed pension can provide predictable income. At the same time, the purchasing power of a fixed payout may decline if inflation remains higher over time.
For an investor whose personal spending inflation is closer to the 8–9% illustrative range discussed above, a fixed-return product may struggle to preserve purchasing power over a long retirement. This can make guaranteed income useful for part of essential spending without necessarily making it appropriate for the entire retirement corpus.
How much corpus do I need before a PMS makes sense?
A PMS carries a SEBI-mandated ₹50 lakh minimum per account.
As a general rule, a portfolio manager cannot accept less than ₹50 lakh in funds or securities from a client, subject to applicable regulatory exceptions. Once an investor meets the applicable PMS minimum-investment requirement, a multi-asset PMS may be one of several structures evaluated as part of a larger retirement portfolio. Meeting the regulatory minimum does not by itself establish suitability as part of a larger retirement portfolio.
The corpus requirement should come first. See how much you need to retire in India.
DISCLAIMER:
Dezerv Investments Private Limited is a SEBI-registered Portfolio Manager (Registration No. INP000007377). Distribution services are offered by Dezerv Distribution Services Private Limited, a wholly owned subsidiary of Dezerv Investments Private Limited, under AMFI Registration No. ARN-248439 and APMI Registration No. APRN-00615. This article is intended solely for general educational and informational purposes and should not be construed as personalised investment, financial planning, tax or legal advice, or as a recommendation, offer or solicitation to invest in any security, financial product or investment strategy. Readers are advised to consult with their financial advisor before making investment decisions based on the information provided herein.
The return and asset-allocation blend figures, calculations, illustrations, estimates and assumptions presented herein are sample scenarios prepared based on the assumptions stated in the article and historical index data. They are for illustrative purposes only and do not represent actual or expected returns or outcomes, nor should they be construed as forecasts or guarantees of future returns. Actual outcomes may vary depending on individual circumstances and prevailing market, economic, tax and regulatory conditions. The information contained herein is not a complete disclosure of every material fact, term or condition.
Investment in the securities market is subject to market risks. Please read all related documents carefully before investing. Past performance, where referred to, is not indicative of future performance and may or may not be sustained. This document should not be construed to be an offer to buy/sell any securities. Please refer to the disclosure document, client agreement, and other related documents for securities/ assets/ portfolios specific risk factors. All trademarks, logos and brand names mentioned herein are used for identification purposes only.


