


What would you have wanted to own in the spring of 1992?
For the twelve months leading up to that spring, India’s stock market had done something it had never done before. The Sensex went from 1,194 to 4,467, a rise of 274% in a single year, and the man at the centre of it was a broker based in Bombay (now Mumbai).
The press called him the Big Bull. The stocks he bought kept rising, drawing more investors in, convinced the market had found a new gear. What they didn’t know was where his money came from. Banks traded government securities with each other, and he helped handle these transactions. But instead of passing the money from one bank to another, he used it to buy shares. Some banks were even given receipts for securities that didn’t exist. His name was Harshad Mehta.
On 23 April 1992, a column by Sucheta Dalal in The Times of India exposed the scam. Banks demanded their money back, buying dried up, and share prices crashed. Within four months, the Sensex had fallen more than 43%, to 2,529. The market took nearly four years to recover. Then it fell again. In September 2001, the Sensex touched 2,594, still below its 1992 peak. Anyone who had bought at the top was still sitting on a loss almost a decade later.
Throughout those nine years, another group of investors earned 12% a year. They had put their money in the Public Provident Fund (PPF), which meant lending it to the Government of India. From April 1986 to January 2000, the PPF paid 12% annually, through the scam, the crash and the long recovery that followed.
I’m not sharing this to argue against equity, which has built far more wealth in India over long periods. But a market can take years to recover from a fall, and what else you hold during that time matters a great deal.
Today, the Nifty is about 12% below its September 2024 peak, inflation has risen to 5.54%, and the RBI has raised rates for the first time since 2023. At the same time, the 10-year government bond now yields 7.29%, its highest since December 2023.
This week, I’ll walk you through how much your FDs and bonds are earning after tax and inflation, and which kinds of fixed income still pay you when the stock market doesn’t.
In this edition:
- What has fixed income done when the Nifty went nowhere?
- How bonds started paying more than they have since 2023
- How to choose fixed income that keeps earning
- How we built our fixed income strategy around the risks investors miss
What has fixed income done when the Nifty went nowhere?
On Dhanteras in November 2012, jewellers in Mumbai’s Zaveri Bazaar had more customers than they had planned for, and jewellery sales across Maharashtra touched roughly ₹750 crore in a single day. Gold had risen sharply that year, yet families kept buying. Part of the reason was in their passbooks: inflation was in double digits, and the one-year FD paid less.
Those families were asking a simple question: are my savings growing faster than prices?
For most Indian families, fixed income still means one thing: a bank FD. It is safe, simple and familiar. And this year, that same question is worth asking, especially if you’re in a higher tax bracket. An FD pays everyone the same rate, but tax decides how much you keep. SBI’s best FD rate is 6.40%, leaving about 4.4% after tax at the 30% slab, below the 5.2% inflation the RBI expects this year. Your balance goes up, but it buys less than it did a year ago.
The FD, though, is only one part of fixed income, and the wider asset class has a very different record.
In a rising market, fixed income is the part of a portfolio investors most want to trim, because next to equity it looks slow. Behavioural economists call this recency bias: we expect the next few years to look like the last few, so the steady part of a portfolio feels least useful just before it tends to matter most.
India’s short-duration debt index shows what that part does over time. Between 2005 and 2017, it did not have a single losing year, and returned 8% or more in nine of those thirteen years, through the global financial crisis, high inflation and long stretches when the stock market went nowhere. In 2008, as markets fell worldwide, it returned 10.76%. But inflation in those years often ran even higher, at 9-12%, so these bonds protected capital more than they grew it. What has changed this year is how much these bonds pay.
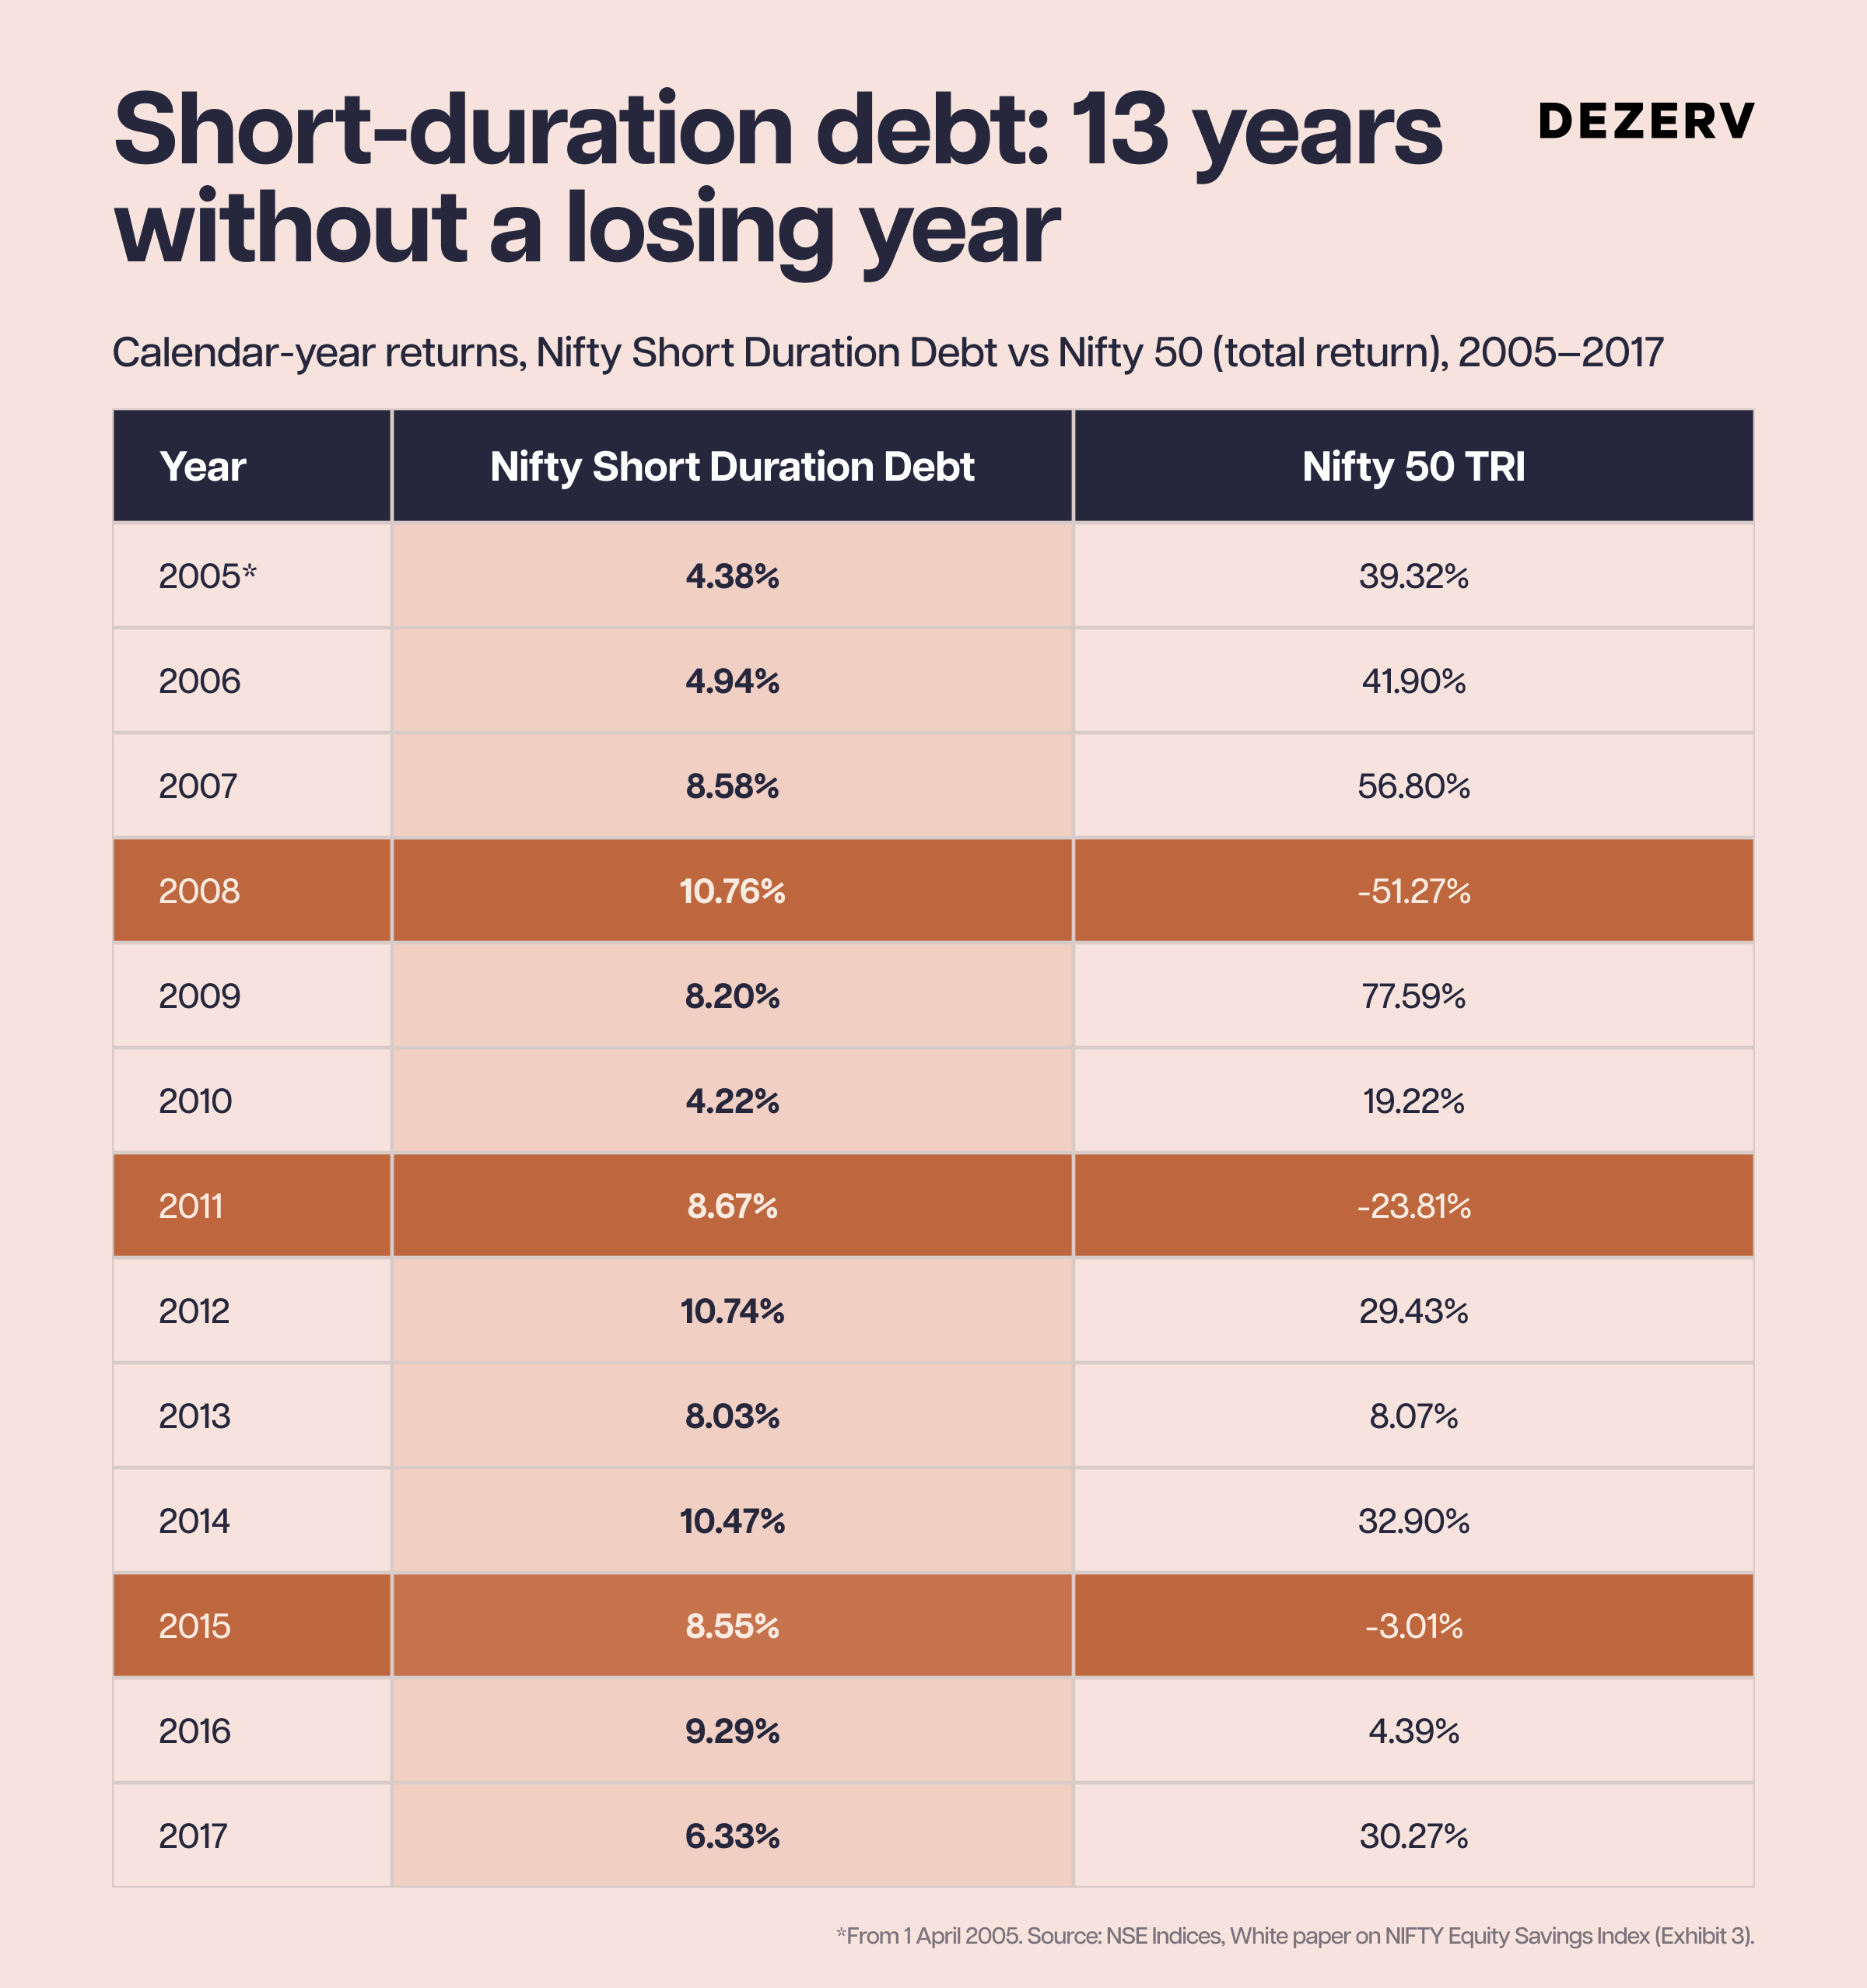
The consistency itself has a simple cause. A bond’s return is largely settled on the day you buy it, by the interest the borrower agrees to pay and the date it promises to return your money. An equity return depends on what the market will pay for your shares when you choose to sell, and in a falling market that can be well below what you paid.
The promise holds best when you lend for short periods to strong borrowers. Fixed income that broke either rule had a rougher time, because the asset class alone guarantees nothing; how you lend does.
Its biggest value shows up elsewhere in the portfolio. It’s called sequence-of-returns risk: a market fall hurts most when you need the money, whether for a child’s education, a house or retirement. An appropriately planned fixed-income allocation can help meet near-term cash-flow needs without having to sell equity investments during a market downturn. The extent to which it can do so depends on the investments held, their liquidity and the timing of your withdrawals. You can’t know in advance which year you’ll need the money. Planning for those needs ahead of time can help you navigate the years you didn’t plan for.
How bonds started paying more than they have since 2023
For most of the last decade, Indians who lent money earned a little less each year. The RBI’s policy rate fell from 7.25% in mid-2015 to 4% by 2020, and FD and bond returns followed.
The global investor Howard Marks has described a much longer version of this in the US, where interest rates fell by about 2,000 basis points between 1980 and 2020. His view is that falling rates helped asset owners and borrowers for forty years, while lenders and savers were left with less and less. India’s falling-rate decade worked the same way: borrowers set the terms, and lenders took what they were offered.
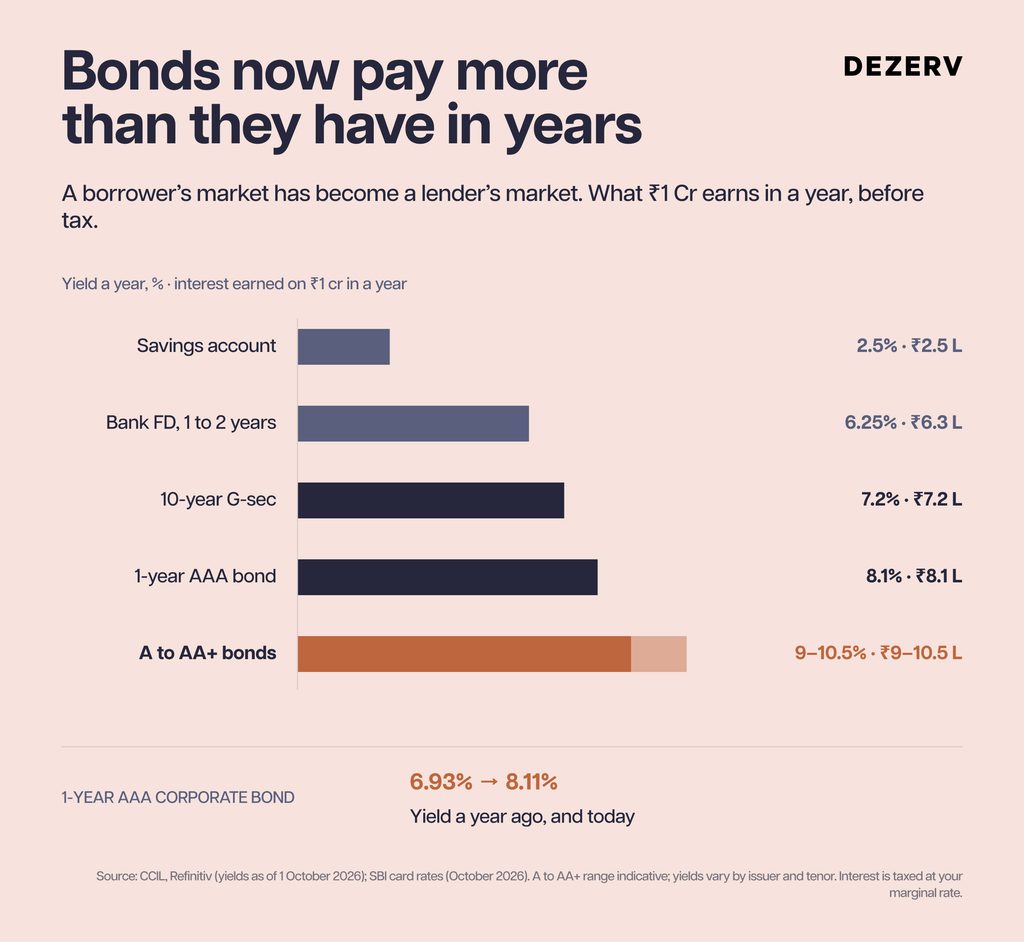
That balance has now shifted. With inflation rising and interest rates climbing worldwide, the RBI has started raising rates too and ruled out cuts for now. As of early October 2026, the 10-year government bond yields 7.29% (the yearly return you earn if you buy it today and hold it until it matures), its highest since December 2023, and a one-year AAA corporate bond pays 8.11%, up from 6.93% a year ago.
Borrowers now have to pay more to raise money, and for the first time in years, the lender is the one being courted.
Indian lenders also start from a higher base than most. Over the past decade, India’s 10-year yield has stayed well above China’s and Malaysia’s, even at its lowest point in 2020. Part of that reflects India’s higher inflation, but it also means an Indian investor doesn’t need to look abroad to be paid well for lending.
A bond also lets you hold on to that yield, because its rate is fixed on the day you buy it, even if rates later fall. Top-rated bonds now pay enough to stay ahead of inflation after tax, which was rare for most of the last decade. For the first time in years, the safe part of a portfolio is earning enough to make a difference.
How do you choose fixed income that keeps earning?
In 2018, IL&FS, one of India’s largest infrastructure financiers, was rated AAA, the highest a borrower can get, weeks before its group defaulted on close to ₹1 lakh crore of debt. A year later, DHFL went from AAA at the start of 2019 to default by June. Both times, ratings were cut only once the damage was done, because a rating reflects what an agency thinks today, not where a borrower will be a year from now.
This is where many investors go wrong. It’s called ‘reaching for yield’: when a safe option pays too little, investors drift towards riskier ones without fully noticing the extra risk they’ve taken on. Today, the bonds paying 9-10.5% are mostly A to AA+ rated, and some of that extra return is to pay for exactly this kind of risk.
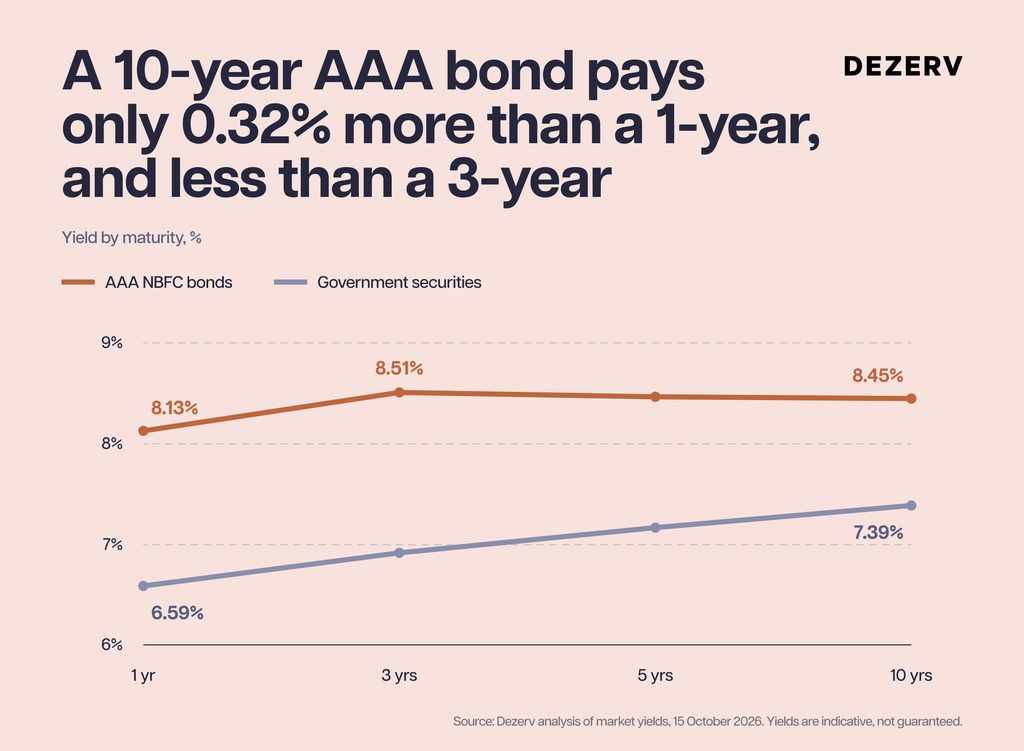
The second risk is how long you lend for. When rates rise, a bond you already own becomes worth less if you sell it, and the longer it has left to run, the bigger the fall. A short bond matures soon, so your money can be lent again at the new rates. And today, lending for longer barely pays: a 10-year AAA bond earns just 0.32% more than a one-year bond.
A debt mutual fund is another way to lend money, spreading your investment across dozens of bonds with a professional manager handling the portfolio. But diversification alone doesn’t remove these risks. The fund’s returns still depend on who it lends to and how long those loans run. So whether you choose an FD, a debt fund or bonds directly, these five things decide what you actually take home:
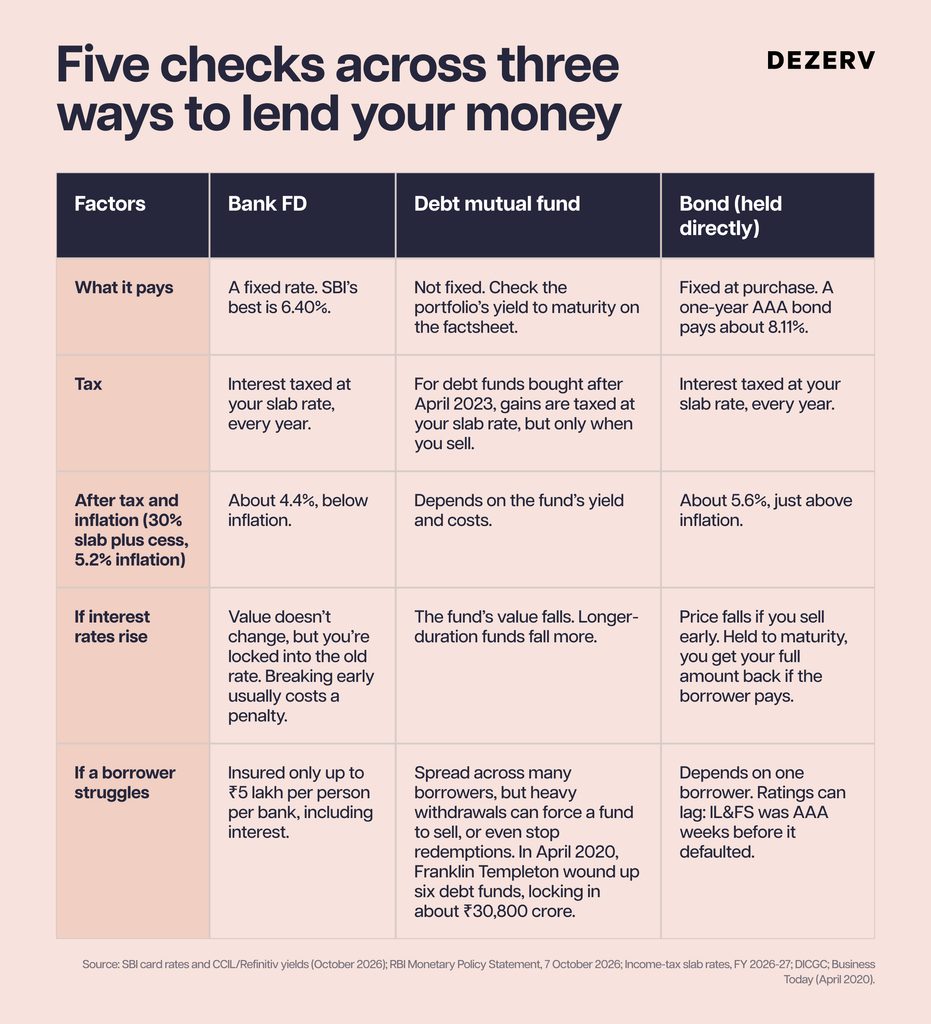
Most people compare only the first row and pick the highest rate, but the real return is decided in the rows below it: tax, inflation, rate risk and the borrower. Fixed income keeps earning when its return comes from interest paid on time. Once it depends on guessing where rates are headed, or on a rating holding up, it starts to behave like a bet.
How we built our fixed income strategy around the risks investors miss
Since a bond pays you from the borrower’s promise, everything rests on who you lend to, and through whom. When we built our fixed income strategy at Dezerv, Dezerv Dynamic Debt Plus, we designed it around those two questions and the risks above. The result is an approach built on three Ds: Direct, Deep Research and Dis-intermediation.
1. Direct Ownership
In a pooled debt fund, investors own units of a shared portfolio. Heavy withdrawals can force the fund to sell bonds at unfavourable prices. In April 2020, Franklin Templeton wound up six debt funds amid heavy redemptions and falling market liquidity, locking in about ₹30,800 crore of investors’ money. In our strategy, each bond sits in the client’s own demat account, so other investors’ exits don’t affect their holdings.
2. Deep research
A rating can change only after a borrower is already in trouble, so we don’t rely on it alone. Every quarter, we check each borrower’s profits, who runs and backs it, whether it can repay on time, and what the rating agencies say. Since we first invested, 52% of our borrowers have had their rating or outlook upgraded.
3. Dis-intermediation
When you buy a bond through a platform, part of the interest can be kept by the middleman, and you may never see how much. We give you the bond’s full interest and charge a separate fee instead, agreed upfront and shown on your statement.
The portfolio keeps a short average duration of about 1.2 years and holds A to AA+ rated bonds yielding 9.85-10.10%. These portfolio details may change over time. Since its launch in April 2023, ₹1 crore invested in Dezerv Dynamic Debt Plus has grown to ₹1.43 crore after fees, against ₹1.25 crore for its benchmark, the CRISIL Composite Bond Index.
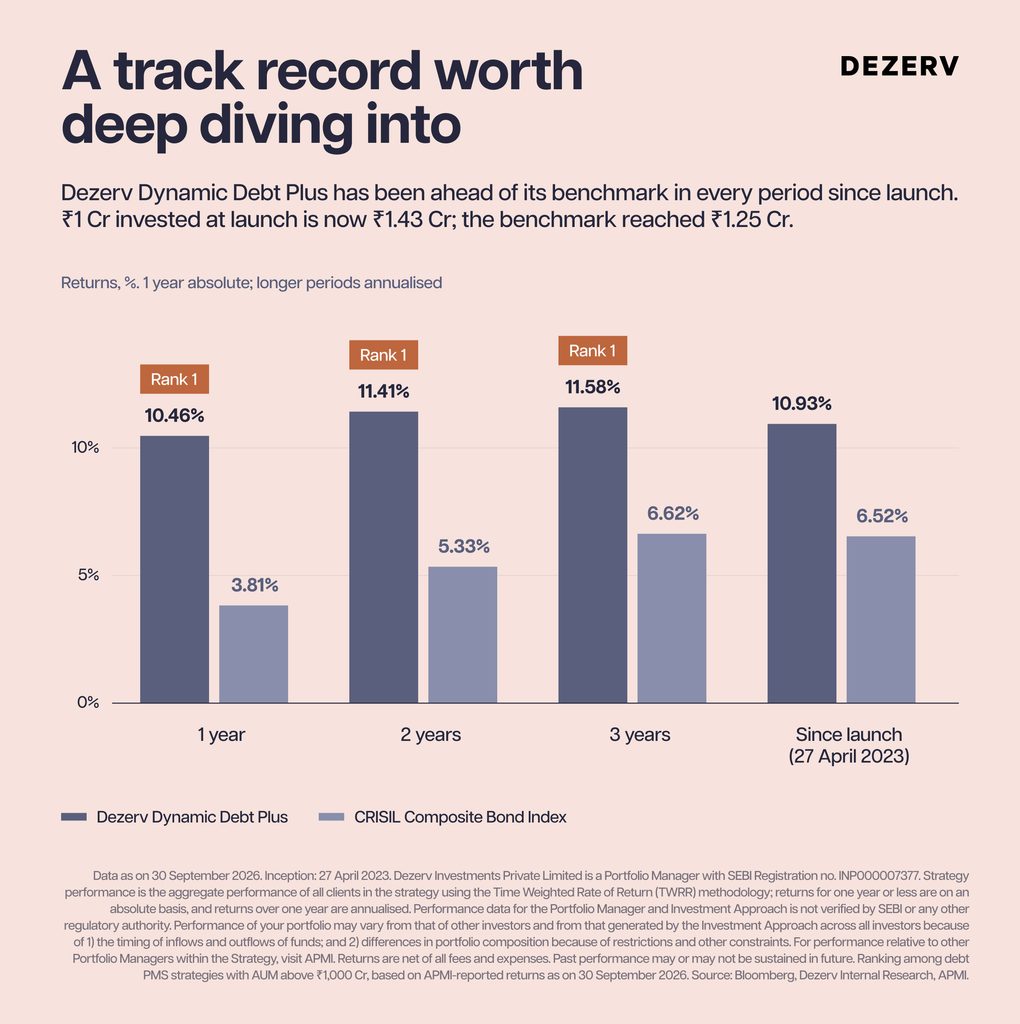
For most of the last decade, fixed income was where Indian investors parked money they didn’t want to think about. Now lenders are being paid well again, inflation is back and the stock market is testing investors’ patience. The safe part of a portfolio deserves the same care as the rest: who you lend to, for how long, and what you keep after tax and inflation.
DISCLAIMER: Dezerv Investments Private Limited is a Portfolio Manager with SEBI Registration no. INP000007377. Distribution services are offered through Dezerv Distribution Services Private Limited vide APRN – 00615. Investment in the securities market is subject to market risks, read all the related documents carefully before investing. The information contained in this document is for general purposes only and is not a complete disclosure of every material fact, terms and conditions. The information provided herein is intended solely for educational purposes. In the preparation of this document, Dezerv has used publicly available information and other sources believed to be reliable. While reasonable care has been taken to present reliable data in this document, Dezerv does not guarantee the accuracy or completeness of the data. Please consult your legal, tax and financial advisors to determine the implications or consequences of your investments in such securities/ assets/ portfolios or before making any investment decisions.