


On three consecutive Independence Days, the Nifty 50 kept coming back to the same level, a little above 24,000: in August 2024, again in 2025, and again in 2026. Anyone glancing once a year would think nothing had happened. A great deal had happened. Foreign investors pulled more than four lakh crore rupees out of Indian shares, valuations cooled to their lowest against emerging-market peers in about two decades, and corporate profits slumped and then, this year, turned sharply higher. The flat line hid a market being rebuilt. What that rebuild sets up next is the real question for 2026.
In short: After two years of going sideways, Indian equities enter the second half of 2026 with signs of improvement in a factor that had remained weak: company earnings. Nifty 50 profits grew about 18% in the June 2026 quarter, the fastest in ten quarters, and revenue growth led the way rather than cost-cutting. Valuations have eased to below their five-year average and to roughly a two-decade low relative to other emerging markets, and foreign investors turned net buyers in July and August, 2026 after a long selling stretch. The live risks are a fresh crude spike, margin pressure and a weaker rupee. For a long-term investor, this is the kind of setup where history has tended to reward time in the market over attempts to time the turn, though past patterns may not repeat.
On this page
- Why has the Nifty gone nowhere for two years?
- What is driving the economy while the index stalled?
- Are corporate balance sheets actually healthier?
- Is the earnings recovery real and broad-based?
- Have valuations become reasonable again?
- Are foreign investors coming back?
- What are the risks to this outlook?
- What does this mean for long-term investors?
- Exploring Equity Strategies at Dezerv
- Frequently asked questions
Why has the Nifty gone nowhere for two years?
The Nifty 50, India’s benchmark index of 50 large companies, is a small amount higher than it was two years ago, having dipped and recovered in between. That flat headline is the result of several forces cancelling out rather than a quiet market.
In late 2024, Indian equity valuations were elevated relative to their own historical ranges across several market segments. A large share of the market traded at rich multiples, which left little room for disappointment. What followed was a long reset: the Reserve Bank of India (RBI) tightened credit conditions into 2025, and a Foreign Portfolio Investor (FPI, an overseas institution investing in Indian markets) selling wave took hold. In March 2026, a conflict in West Asia pushed Brent crude above $100 a barrel for the first time since 2022 (U.S. Energy Information Administration, 2026), and foreign outflows that month alone reached ₹1,17,775 crore (NSDL data, via Outlook Money, 1 Aug 2026).
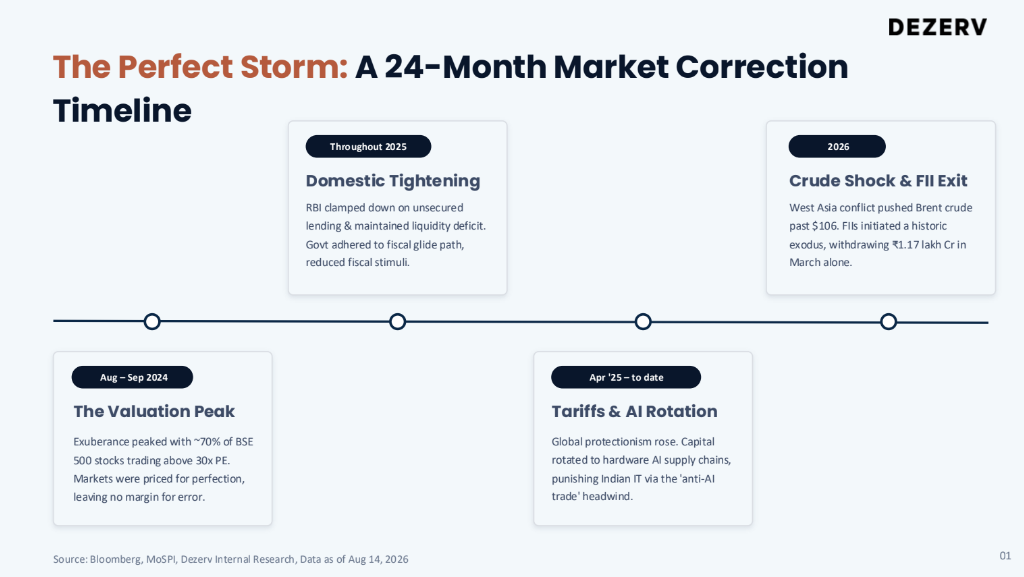
The economy underneath did not deteriorate the way the index suggested. That gap between a stalling market and a growing economy is what set up the current picture. The table below is the one-glance version of where the major indicators stand.
The state of Indian equities, August 2026
| Indicator | Reading | Source (as of) |
| Nifty 50 level | A little above 24,000; roughly flat over two years | NSE (Aug 2026) |
| Q1 FY27 earnings (Nifty 50) | Profit after tax +18% YoY; revenue +19.4%; both multi-quarter highs | Brokerage aggregates of results (Aug 2026) |
| Nifty 50 trailing P/E | ~20.5, below the 5-year median of ~22.1 | NSE index data (17 Aug 2026) |
| India vs MSCI Emerging Markets valuation | Premium near a two-decade low | MSCI (2026) |
| India weight in MSCI EM | ~12%, down from a ~19.4% peak in late 2024 | MSCI (2026) |
| Foreign portfolio flows | Net buyers in Jul (+₹20,199 cr) and Aug 1H (+₹16,621 cr), after months of selling | NSDL, via Outlook Money / Business Standard (Aug 2026) |
| Domestic SIP inflows | ₹31,961 crore in July, near record levels | AMFI (Jul 2026) |
| RBI repo rate | 5.25%, after 125 bps of cuts in 2025; neutral stance | RBI MPC (Aug 2026) |
| GDP growth | 7.8% in Q4 FY26; RBI FY27 forecast 6.7% | MoSPI / NSO (2026) |
| CPI inflation | 4.45% in July; RBI FY27 forecast 5.0% | MoSPI (2026) |
| Bank credit to industry | +19.2% YoY, broad-based | RBI sectoral deployment (Jul 2026) |
Figures are point-in-time and change with the market.
Want to understand what has been driving your portfolio’s performance through this market cycle? Book a portfolio review with Dezerv
What is driving the economy while the index stalled?
Through the flat market, policy shifted decisively towards putting money in people’s hands, which supports consumption and, in time, corporate revenue.
- Lower income tax. From the Union Budget 2025-26, annual income up to ₹12 lakh carries no income tax under the new regime, and up to ₹12.75 lakh for salaried taxpayers after the standard deduction (Press Information Bureau, 1 Feb 2025).
- A simpler GST. The Goods and Services Tax (GST), India’s indirect tax, was rationalised from four rates to two main rates of 5% and 18%, with a 40% rate on a few sin and luxury goods, effective 22 September 2025 (56th GST Council; EY India summary, Sep 2025).
- Cheaper money. The RBI cut the repo rate by a cumulative 125 basis points through 2025 to 5.25%, and moved banking-system liquidity from deficit to surplus (RBI Monetary Policy Committee, Aug 2026).
- More trade doors. India now has nine free-trade agreements spanning 38 countries; the India–European Free Trade Association pact came into force on 1 October 2025 and the India–United Kingdom agreement was signed on 24 July 2025 (EFTA; PIB, 2025-26).
The result shows up in the hard data: GDP grew 7.8% in the January–March 2026 quarter (MoSPI, via Business Standard, Jun 2026), and the RBI expects 6.7% for FY27.
Are corporate balance sheets actually healthier?
A recovery needs companies both willing and able to invest. On the ‘able’ side, the question is whether companies have the balance-sheet room to invest. The demand signals suggest capacity is now being put to work.
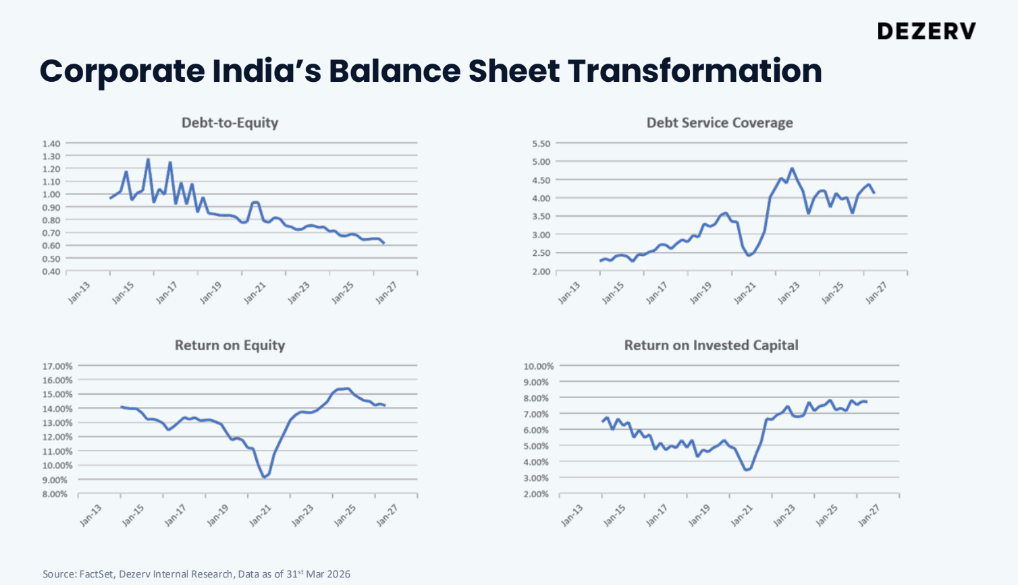
Demand is now meeting that repaired capacity. Manufacturing capacity utilisation has climbed back above its long-run average, to around 74–76% (RBI OBICUS survey, via Business Standard, 2025-26), the level at which firms typically start planning fresh investment rather than sweating existing plants. The banks are lending again, too: credit to industry grew 19.2% year on year in the fortnight to 30 July 2026, and the growth was broad-based across micro, small, medium and large firms (RBI sectoral deployment data, Jul 2026). The acceleration in credit growth may provide support for future corporate investment, although the extent to which this translates into capital expenditure remains to be seen.
Is the earnings recovery real and broad-based?
The June 2026 quarter showed a meaningful improvement in both profit and revenue growth. Whether this develops into a sustained and broad-based earnings cycle will depend on subsequent quarters.
Nifty 50 companies grew profit after tax (PAT, the bottom-line profit) by about 18% year on year, the strongest in ten quarters and well ahead of analyst estimates. More important than the headline, revenue grew about 19.4%, the fastest in eight quarters (brokerage aggregates of results, via Free Press Journal and Zee Business, Aug 2026).
Why does the revenue detail matter more than the profit number? For much of the slow patch, whatever profit growth companies managed came from cutting costs, and margins can only be squeezed so far. Sales growth is the more durable driver, because it reflects real demand rather than a one-off saving. A quarter led by revenue is a different, sturdier signal than a quarter led by cost control.
Watch out: company earnings are reported in rupees, so part of the reported growth in export-heavy sectors reflects a weaker rupee rather than higher volumes. Read profit growth alongside revenue growth, not on its own.
Have valuations become reasonable again?
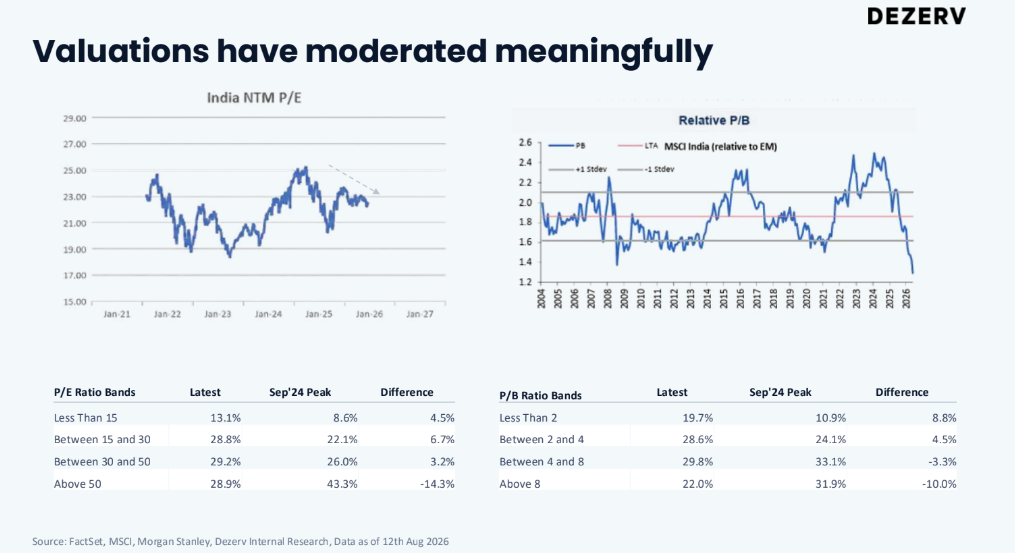
Two years of a flat index while earnings caught up did something useful: it reduced valuation multiples without requiring a sharp index decline.
The Nifty 50 trades at a trailing price-to-earnings (P/E, the ratio of price to annual profit) of about 20.5, below its five-year median of roughly 22.1 and its ten-year median (NSE index data, via IndexPE, 17 Aug 2026). That is not screaming cheap, but for large Indian companies it is the lower end of the recent range rather than the top.
The starker shift is relative to the rest of the emerging world. India has long traded at a premium to other emerging markets, and foreign investors often cited that premium as a reason to stay light. That premium has now compressed to roughly a two-decade low (VanEck; MSCI data, 2026), and India’s weight in the MSCI Emerging Markets index has fallen from a record of about 19.4% in late 2024 to around 12%. Much of that reflects a rush into a handful of artificial-intelligence-linked names in Taiwan and South Korea, which together now make up close to half of their respective indices. India’s relative valuation premium has narrowed materially, reducing one of the valuation concerns that had been cited by some global investors.
Are foreign investors coming back?
For most of the last two years the answer was no, and that selling was a big reason the index stalled. Foreign investors were net sellers of more than four lakh crore rupees of Indian equities across 2025 and the first half of 2026, including that ₹1,17,775 crore exit in March 2026.
Two things changed the balance. First, domestic investors kept buying throughout. Monthly Systematic Investment Plan (SIP, a fixed regular investment into mutual funds) inflows reached ₹31,961 crore in July 2026, near record levels (AMFI, Jul 2026), domestic mutual-fund inflows provided an important source of demand during a period of foreign selling. Second, the foreign flow itself turned: FPIs were net buyers of ₹20,199 crore in July and ₹16,621 crore in the first half of August 2026, the first sustained buying after a four-month selling streak (NSDL, via Outlook Money and Business Standard, Aug 2026).
A word of caution on this point: for the 2026 calendar year to date, foreign investors are still net sellers of Indian equities. Two months of buying is a change in direction, not yet a completed trend.
Want to understand how your portfolio is positioned across market segments and asset classes? Book a portfolio review with Dezerv.
In their words
“The most heartening thing for me this earnings season has been the pickup in sales growth.”
— Kamlesh Lahoti, Head of Quant Research, Dezerv (Dezerv webinar, 15 Aug 2026)
The longer-run point is one Benjamin Graham made decades ago, and Warren Buffett later popularised:
“In the short run, the market is a voting machine; in the long run, a weighing machine.”
— Benjamin Graham (Security Analysis, 1934)
For two years the voting machine kept the Nifty flat. Earnings are what the weighing machine measures, and those have started to move.
What are the risks to this outlook?
A constructive case is not a certain one. Several things could interrupt it, and an honest reading names them.
- Crude and inflation. The March 2026 oil spike showed how quickly geopolitics can reach Indian prices. Consumer price inflation had already risen to 4.45% in July 2026 (MoSPI data, Jul 2026), and a fresh energy shock would push it higher and complicate the RBI’s room to keep rates low.
- Margins. The June quarter’s strength came partly at the cost of margins for some companies. Whether firms can grow revenue and protect profitability at the same time is the open question for the next few quarters.
- The rupee. A weaker rupee can reduce foreign-currency returns for overseas investors and may affect the relative attractiveness of Indian assets
- Trade. An interim tariff framework with the United States took effect in February 2026, but the comprehensive agreement was still unsigned as of August 2026 (KPMG, 2026). Markets may already reflect some of this uncertainty, but the eventual terms and their economic implications remain relevant.
What does this mean for long-term investors?
The honest summary is that several indicators have become more supportive, including earnings growth, valuation moderation and recent foreign inflows. For a long-term investor, that distinction points to behaviour rather than prediction.
Time in the market has mattered more than timing it. In Dezerv’s analysis of historical Nifty 50 TRI rolling returns over the stated period, seven-year rolling observations were positive. This is a historical index observation only and does not imply that future seven-year periods will necessarily generate positive return. An analysis of Nifty 50 rolling returns since 1999 shows no seven-year period in which the index lost money; the weakest seven-year outcome was about +5% a year, and it returned more than 10% a year in roughly 85% of those windows (NSE / niftyindices data; past performance may or may not be sustained). Investors who exit during sharp declines may miss subsequent recoveries.
Selection matters more in some parts of the market than others. Mid- and small-cap companies can show greater dispersion in valuations, earnings growth and investment outcomes than large-cap indices. In such environments, security-level outcomes may vary materially, although identifying future winners consistently remains difficult. Dezerv’s analysis of more than six lakh mutual-fund portfolios found that fewer than 1% beat their respective benchmarks by more than one percentage point (Dezerv Wealth Monitor, data until Nov 2025), which is a reminder that a disciplined process, and honest asset allocation across equity and other assets, tends to matter more than any single call.
None of this is a recommendation to buy or sell on a particular day, or a view on any individual stock. How much of your portfolio should sit in equities, and in which segments, depends on your goals, your time horizon and your tolerance for the declines that come even in good years.
Exploring equity strategies at Dezerv
For investors evaluating their long-term equity allocation, Dezerv offers different approaches depending on the role the allocation is intended to play within the portfolio.
Dezerv Equity Revival Strategy (ERS)
A diversified equity strategy that can allocate across large-cap, mid-cap, small-cap, value, growth, contra. The allocation is determined based on the fund manager’s assessment of economic, market and security-specific factors.
Dezerv Alpha Focus Strategy (AFS)
A diversified equity strategy that can allocate across mid-cap, small-cap, value, growth and contra categories, based on the fund manager’s assessment of economic, market and security-specific factors.
Both strategies seek long-term capital appreciation, are classified as equity strategies and are intended for investors with a high-risk appetite. The indicative investment horizon stated for both strategies is 36 months.
If you want a second view on how your own equity allocation is positioned for this cycle, you can book a portfolio review with Dezerv.
Key takeaways
- The Nifty 50 is roughly flat over two years, but the market underneath was reset: heavy foreign selling, cooling valuations, and a slump-then-recovery in profits.
- The June 2026 quarter delivered the missing piece: Nifty 50 profit up about 18% and revenue up about 19.4%, both multi-quarter highs, and led by sales rather than cost-cutting.
- Valuations have eased below the five-year average and to roughly a two-decade low versus other emerging markets; foreign investors turned net buyers in July and August after a long selling stretch.
- The real risks are a fresh crude spike and inflation, margin pressure, a weaker rupee, and the unfinished India–US trade deal.
- For long-term investors, historically, staying invested and being selective has tended to matter more than timing the turn; past performance may or may not be sustained
Frequently Asked Questions
Is 2026 a good time to invest in Indian stocks? Several indicators have improved in 2026, including earnings growth, valuation multiples and recent foreign flows. These developments describe a more supportive market backdrop than in parts of 2024–25, but they do not establish that future equity returns will be positive. Whether an equity investment is appropriate depends on factors including the investor’s objectives, horizon, existing allocation and risk tolerance
Why did the Indian stock market stay flat for two years? Several forces offset each other. Foreign investors sold more than four lakh crore rupees of equities across 2025 and early 2026, valuations that were stretched in late 2024 cooled off, and a West Asia conflict spiked crude in March 2026. At the same time the economy kept growing and profits recovered, so the index consolidated instead of falling.
Are Indian stocks still expensive?Large-cap valuation multiples have moderated relative to recent historical levels. The Nifty 50 trades at a price-to-earnings ratio of about 20.5, below its five-year median of roughly 22.1, and India’s premium over other emerging markets is near a two-decade low. Small-cap valuations remain richer than large-caps, so the answer varies by segment.
Are foreign investors buying Indian stocks again? They turned net buyers in July 2026 (₹20,199 crore) and the first half of August (₹16,621 crore), after a four-month selling streak. However, for the 2026 calendar year to date foreign investors are still net sellers overall, so this is a change in direction rather than a completed trend.
What are the biggest risks to Indian equities now? A fresh spike in crude oil and inflation, which had already risen to 4.45% by July 2026; pressure on company margins after a strong quarter; a weaker rupee; and the still-unsigned comprehensive trade agreement with the United States. Any of these could interrupt the recovery.
Should I invest a lump sum or in staggered instalments? This is a general educational point, not advice for your situation. Both approaches are widely used: staggering investments spreads the entry points over time and therefore reduces dependence on a single purchase date, while a lump-sum investment deploys the capital immediately and gives it greater time in the market. The right choice depends on your horizon, how much of your portfolio is already in equities, and your tolerance for short-term swings. Discuss your specific case with a qualified professional.
Disclaimer
Dezerv Investments Private Limited (“DIPL”) is registered with the Securities and Exchange Board of India (“SEBI”) as a Portfolio Manager (SEBI Registration No. INP000007377). Distribution services are offered through Dezerv Distribution Services Private Limited, a wholly owned subsidiary of DIPL, which is registered with AMFI as a Mutual Fund Distributor (ARN-248439) and with APMI (APRN-00615).
This article is intended solely for general information and educational purposes. The views, opinions, market commentary, estimates, data and other information expressed herein are based on information available as of the dates stated and are subject to change without notice. They do not constitute investment advice, financial planning, a recommendation, solicitation, invitation or offer to buy, sell or hold any security, financial product or investment strategy, and should not be construed as such.
The information contained herein is general in nature and does not take into account the specific investment objectives, financial situation, risk profile, investment experience, investment horizon or other circumstances of any particular investor. No representation is made that any investment, strategy, security, asset class or market discussed herein is suitable for any particular person. Investors should independently evaluate the appropriateness of any investment and seek advice from a suitably qualified professional, where required.
References to historical market performance, index returns, earnings, valuations, flows or other historical data are provided for illustrative and informational purposes only. Past performance is not indicative of future performance and may or may not be sustained in the future. Any forward-looking statements, expectations or assessments of market conditions are inherently uncertain and actual outcomes may differ materially.
Investment in securities market are subject to market risks. Read all the related documents carefully before investing. The information/data contained herein is not intended to be a substitute for professional investment advice and, by itself, is not sufficient for making or implementing an investment decision or investment strategy.